What is a Grouped Frequency Distribution Table
There are 3 methods for calculation of mean :
- Direct Method
- Assumed mean deviation method
- Step deviation method.
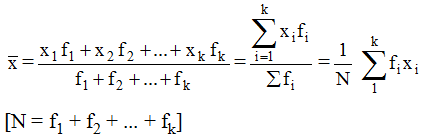
1. Direct Method for Calculation of Mean
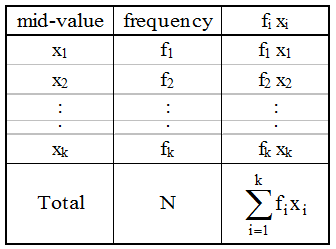
According to direct method
2. Assumed Mean Method
Arithmetic mean = \(a + \frac{{\sum\limits_{i = 1}^n {{f_i}{d_i}} }}{{\sum\limits_{i = 1}^n {{f_i}} }}\)
Note : The assumed mean is chosen, in such a manner, that
- It should be one of the central values.
- The deviation are small.
- One deviation is zero.
Working Rule :
Step 1 : Choose a number ‘a’ from the central values of x of the first column, that will be our assumed mean.
Step 2 : Obtain deviations di by subtracting ‘a’ from xi. Write down hese deviations against the corresponding frequencies in the third column.
Step 3 : Multiply the frequencies of second column with corresponding deviations di in the third column to prepare a fourth column of fidi.
Step 4 : Find the sum of all the entries of fourth column to obtain ∑fidi and also, find the sum of all the frequencies in the second column to obtain ∑fi.
Read More:
3. Step Deviation Method
Deviation method can be further simplified on dividing the deviation by width of the class interval h. In such a case the arithmetic mean is reduced to a great extent.
Mean (\(\bar x\)) = a + \(\frac{{\Sigma {f_i}{u_i}}}{{\Sigma {f_i}}} \times h\)
Working Rule :
Step-1 : Choose a number ‘a’ from the central values of x(mid-values)
Step-2 : Obtain ui = \(\frac{{{x_i} – a}}{h}\)
Step-3 : Multiply the frequency fi with the corresponding ui to get fiui.
Step-4 : Find the sum of all fiui i.e., ∑fiui
Step-5 : Use the formula = a + \(\frac{{\Sigma {f_i}{u_i}}}{{\Sigma {f_i}}} \times h\) to get the required mean.
Grouped Frequency Distribution Table Example Problems with Solutions
Example 1:
| Mid-values | 2 | 3 | 4 | 5 | 6 |
| Frequencies | 49 | 43 | 57 | 38 | 13 |
Find the mean by direct method.
Solution:
| Mid Values | frequencies (fi) | fixi |
| 2 | 49 | 98 |
| 3 | 43 | 129 |
| 4 | 57 | 228 |
| 5 | 38 | 190 |
| 6 | 13 | 78 |
| Total | N = Σfi = 50 | Σfixi = 2750 |
Mean = \(\frac{{\sum {f_i}{x_i}}}{{\sum {f_i}}}\) = \(\frac{{723}}{{200}}\) = 3.615
Example 2: Find the mean of the following frequency distribution :
| Class Interval | Frequency |
| 10-30 | 90 |
| 30-50 | 20 |
| 50-70 | 30 |
| 70-90 | 20 |
| 90-110 | 40 |
Solution:
| Class Interval | f | Mid value (x) | f × x |
| 10-30 | 90 | 20 | 1800 |
| 30-50 | 20 | 40 | 800 |
| 50-70 | 30 | 60 | 1800 |
| 70-90 | 20 | 80 | 1600 |
| 90-110 | 40 | 100 | 4000 |
| Σf = 200 | | Σfx = 10000 |
Mean = \(\frac{{\sum {f}{x}}}{{\sum {f}}}\) = \(\frac{{10000}}{{200}}\) = 50
Example 3: A survey was conducted by a group of students as a part of their environment awareness programme, in which they collected the following data regarding the number of plants in 20 houses in a locality. Find the mean number of plants per house.
| Number of plants | 0 – 2 | 2 – 4 | 4 – 6 | 6 – 8 | 8 – 10 | 10 – 12 | 12 – 14 |
| No. of houses | 1 | 2 | 1 | 5 | 6 | 2 | 3 |
Which method did you use for finding the mean and why ?
Solution:
| Number of plants | Number of houses (f) | Mid value (x) | f × x |
| 0-2 | 1 | 1 | 1 |
| 2-4 | 2 | 3 | 6 |
| 4-6 | 1 | 5 | 5 |
| 6-8 | 5 | 7 | 35 |
| 8-10 | 6 | 9 | 54 |
| 10-12 | 2 | 11 | 22 |
| 12-14 | 3 | 13 | 39 |
| Σf = 20 | | Σfx = 162 |
Mean = \(\frac{{\sum {f}{x}}}{{\sum {f}}}\) = \(\frac{{162}}{{20}}\) = 8.1
Example 4: Calculate the mean for the following distribution:
| Variable | 5 | 6 | 7 | 8 | 9 |
| Frequency | 4 | 8 | 14 | 11 | 3 |
Solution:
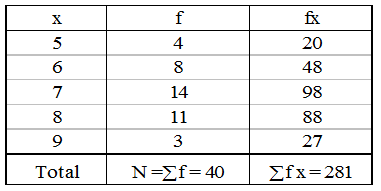
∴ Mean = \(\frac{{\sum f\,x}}{{\sum f}} = \frac{{281}}{{40}}\) = 7.025
Example 5: Find the mean of the following frequency distribution :
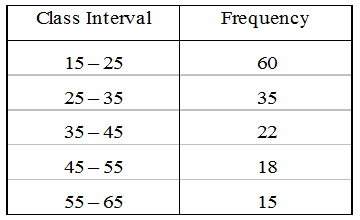
Solution:
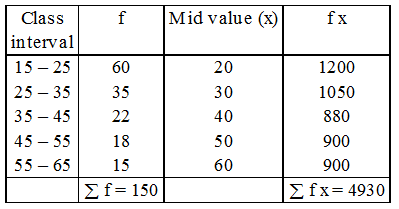
Mean = \(\frac{{\sum f\,x}}{{\sum f}} = \frac{{4930}}{{150}} = 32.8\overline 6\) or 32.87 (approx.)
Example 6: Find the mean of the following distribution by direct method.
| Class interval | 0 – 10 | 11 – 20 | 21 – 30 | 31 – 40 | 41 – 50 |
| Frequency | 3 | 4 | 2 | 5 | 6 |
Solution:
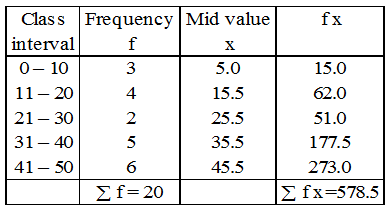
Mean = \(\frac{{\sum f\,x}}{{\sum f}} = \frac{{578.5}}{{20}}\) = 28.9
Example 7: For the following distribution, calculate mean using all the suitable methods.
| Size of Item | 1 – 4 | 4 – 9 | 9 – 16 | 16 – 27 |
| Frequency | 6 | 12 | 26 | 20 |
Solution:
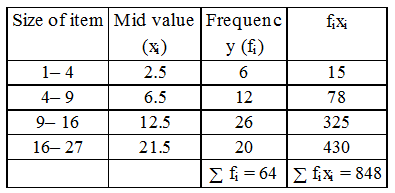
Mean = \(\frac{{\sum f\,x}}{{\sum f}} = \frac{{848}}{{64}}\) = 13.25
Example 8: The following table gives the distribution of total household expenditure (in rupees) of manual workers in a city.
| Expenditure (in rupees) | 100-150 | 150-200 | 200-250 | 250-300 | 300-350 | 350-400 | 400-450 | 450-500 |
| Frequency | 24 | 40 | 33 | 28 | 30 | 22 | 16 | 7 |
Solution: Let assumed mean = 275
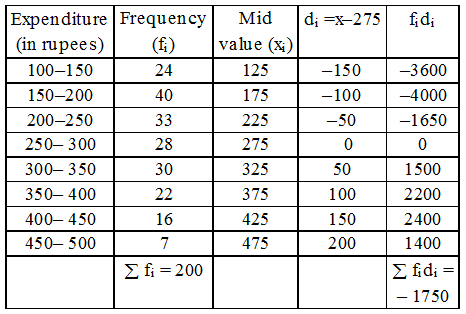
\(\bar x = a + \frac{{\Sigma {f_i}{d_i}}}{{\Sigma {f_i}}}\) = 275 + \(\frac{{ – 1750}}{{200}}\) = Rs 266.25
Example 9: Calculate the arithmetic mean of the following distribution :
| Class Interval | Frequency |
| 0 – 50 | 17 |
| 50 –100 | 35 |
| 100 –150 | 43 |
| 150–200 | 40 |
| 200– 250 | 21 |
| 250– 300 | 24 |
Solution: Let assumed mean = 175 i.e. a = 175

Now , a = 175
\(\bar x = a + \frac{{\Sigma {f_i}{d_i}}}{{\Sigma {f_i}}}\) = 175 + \(\frac{{ – 4750}}{{180}}\)
= 175 – 26.39 = 148.61 approx.
Example 10: Calculate the arithmetic mean of the following frequency distribution :
| Class interval | 50– 60 | 60–70 | 70–80 | 80–90 | 90– 100 |
| Frequency | 8 | 6 | 12 | 11 | 13 |
Solution: Let assumed mean = 75 i.e., a = 75
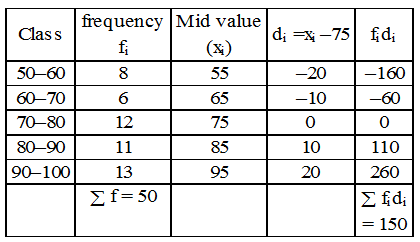
a = 75, Σfidi= 150, Σfi = 50
Mean \(\bar x = a + \frac{{\Sigma {f_i}{d_i}}}{{\Sigma {f_i}}}\) = 75 + \(\frac{{ 150}}{{50}}\) = 78
Example 11: Thirty women were examined in a hospital by a doctor and the number of heart beats per minute were recorded and summarised as follows. Find the mean heart beats per minute for these women, choosing a suitable method.
| Number of heart beats per minute | Frequency |
| 65– 68 | 2 |
| 68–71 | 4 |
| 71–74 | 3 |
| 74–77 | 8 |
| 77– 80 | 7 |
| 80– 83 | 4 |
| 83– 86 | 2 |
Solution: Let assumed mean a = 75.5
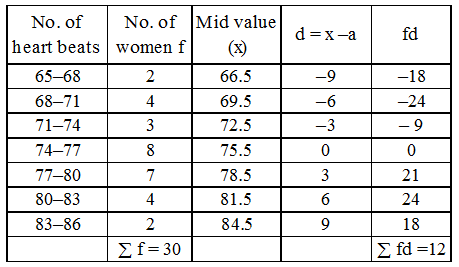
Mean = \(a + \frac{{\Sigma fd}}{{\Sigma f}} = 75.5 + \frac{{12}}{{30}}\) = 75.5 + 0.4 = 75.9
Example 12: To find out the concentration of SO2 in the air (in parts per million, i.e.ppm), the data was collected for 30 localities in a certain city and is presented below :
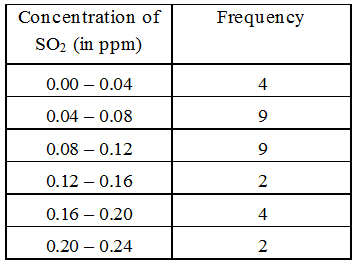
Find the mean concentration of SO2 in the air.
Solution: Let the assumed mean a = 0.10.
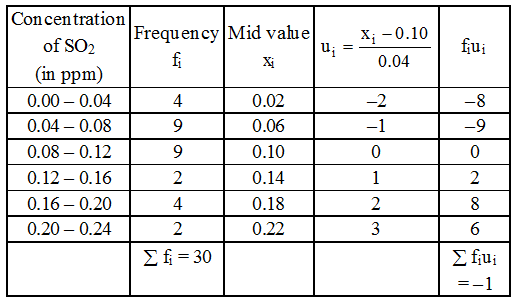
By step deviation method
Mean = a + \(\frac{{\Sigma {f_i}{u_i}}}{{\Sigma {f_i}}}\) × h
= 0.10 + \(\frac{{–1}}{{30}} \times 0.04\)
= 0.10 – 0.0013
= 0.0987
= 0.099 ppm
Example 13: The weekly observation on cost of living index in a certain city for the year 2004–2005 are given below. Compute the mean weekly cost of living index.
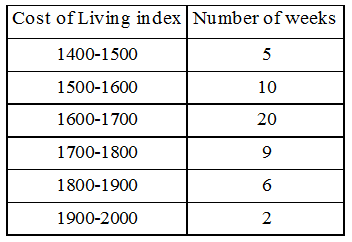
Solution: Let assumed mean be 1750 i.e., a = 1750
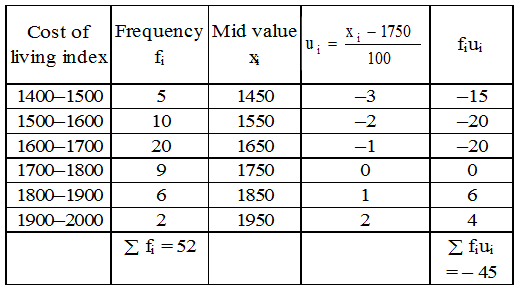
By step deviation method
Mean (\(\bar x\)) = a + \(\frac{{\Sigma {f_i}{u_i}}}{{\Sigma {f_i}}}\) × h
= 1750 + \(\frac{{ – 45}}{{52}} \times 100\)
= 1750 – 86.54
= 1663.46
Hence, the mean weekly cost of living index
= 1663.46
Example 14: Find the mean marks from the following data by step deviation method
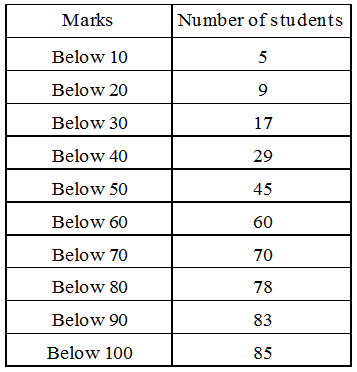
Solution: Let assumed mean = 55 ⇒ a = 55
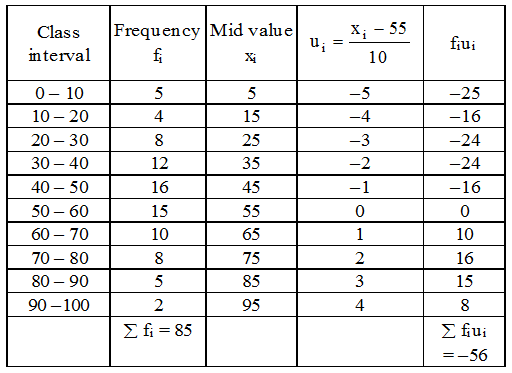
Here, a = 55, h = 10,
Σfi = 85, Σfiui = –56
Mean (\(\bar x\)) = a + \(\frac{{\Sigma {f_i}{u_i}}}{{\Sigma {f_i}}}\) × h
h = 55 + \(\frac{{ – 56}}{{85}} \times 10\)
= 55 – 6.59 = 48.41
Hence, mean mark = 48.41.
Example 15: Find the mean age of 100 residents of a colony from the follwing data :
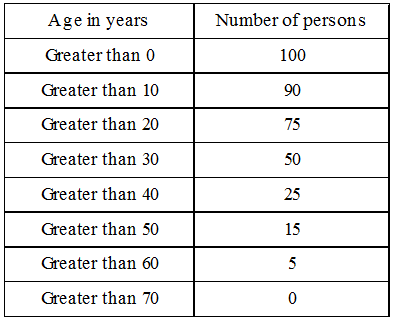
Solution: Let assumed mean a = 35
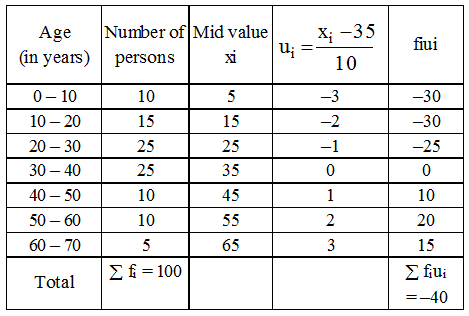
Here, a = 35, h = 10
\(\bar x\) = a + \(\frac{{\Sigma {f_i}{u_i}}}{{\Sigma {f_i}}}\) × h
⇒ \(\bar x\) = 35 + \(\frac{{ – 40}}{{100}} \times 10\) = 31
Hence, the mean age = 31 years
Example 16: The following distribution show the daily pocket allowance of children of a locality. The mean pocket allowance is Rs. 18.00. Find the missing frequency f.
Solution: we have,
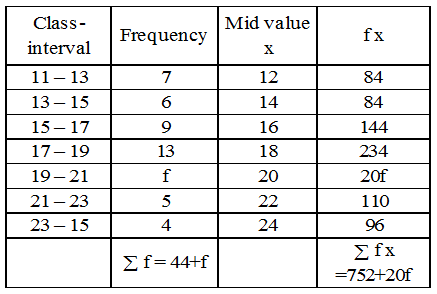
Mean \(\bar x\) = \(\frac{{\Sigma fx}}{{\Sigma f}}\) ⇒ 18 = \(\frac{{752 + 20f}}{{44 + f}}\)
⇒ 18 (44 + f) = 752 + 20f
⇒ 752 + 20f = 792 + 18f
⇒ 2f = 40
⇒ f = 20
Hence, the missing frequency is 20.
Example 17: The arithmetic mean of the following frequency distribution is 50. Find the value of p.
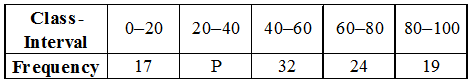
Solution:
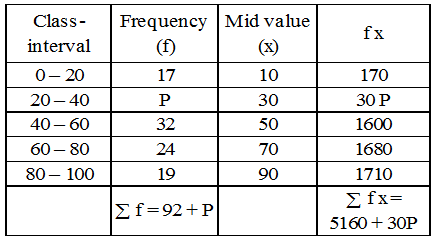
Mean \(\bar x\) = \(\frac{{\Sigma fx}}{{\Sigma f}}\) ⇒ 50 = \(\frac{{5160 + 30P}}{{92 + P}}\)
⇒ 50 (92 + P) = 5160 + 30 P
⇒ 4600 + 50 P = 5160 + 30P
⇒ 20 P = 560
⇒ P = 28
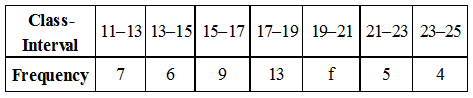
Example 18: The mean of the following frequency distribution is 62.8 and the sum of all frequencies is 50. Compute the missing frequencies f1 and f2 :
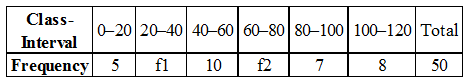
Solution:
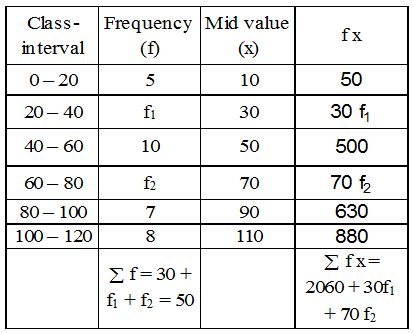
30 + f1 + f2 = 50 ⇒ f1 + f2 = 20 ….(1)
Mean = \(\frac{{\Sigma fx}}{{\Sigma f}}\) ⇒ 62.8 = \(\frac{{2060 + 30{f_1} + 70{f_2}}}{{50}}\)
⇒ 62.8 = \(\frac{{206 + 3{f_1} + 7{f_2}}}{5}\)
⇒ 206 + 3f1 + 7f2 = 314
⇒ 3f1 + 7f2 = 108 ….(2)
3f1 + 3f2 = 60 ….(3)
[Multiplying (1) by 3]
On Subtracting (3) from (2), we get
4f2 = 48 ⇒ f2 = 12
Putting f2 = 12 in (1), we get
f1 = 8