What is the Frequency Polygon
A frequency polygon is the polygon obtained by joining the mid-points of upper horizontal sides of all the rectangles in a histogram.
Construction of a frequency polygon with Histogram.
- Obtain the frequency distribution and draw a histogram representing it.
- Obtain the mid-points of the upper horizontal side of each rectangle.
- Join these mid-points of the adjacent rectangles of the histogram by dotted line segments.
- Obtain the mid-points of two class-intervals of zero frequency i.e. on X-axis, one adjacent to the first, on its left and one adjacent to the last, on its right.These class-intervals are known as imagined class intervals.
- Complete the polygon by joining the mid-points of first and last class intervals to the mid-points of imagined class-intervals adjacent to them.
Read More:
- How are Bar Graphs and Histograms Related
- Mean and its Advantages and Disadvantages
- Median of Grouped Frequency Distribution
- Mode in Statistics
- Pie Charts
- Bar Graph in Statistics
Construction of a frequency polygon without using a histogram
- Obtain the frequency distribution.
- Compute the mid-points of class intervals i.e. class marks.
- Represent class marks on X-axis on a suitable scale.
- Represent frequencies on Y-axis on a suitable scale.
- Plot the points (xi,fi) where xi denotes class mark and fi corresponding frequency.
- Join the points plotted in step V by line segments.
- Take two class intervals of zero frequency, one at the begining and the other at the end. Obtain their mid-points.These classes are known as imagined classes.
- Complete the frequency polygon by joining the mid-points of first and last class intervals to the mid-points of the imagined classes adjacent to them.
Frequency Polygon Example Problems with Solutions
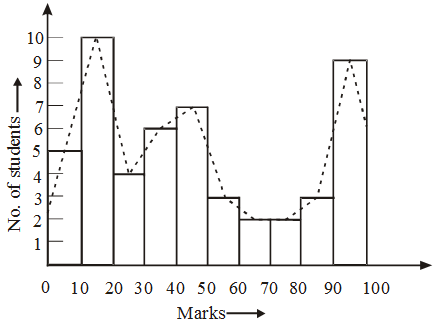
Example 1: For the following data, draw a histogram and a frequency polygon :
Marks : | No. of students : |
0-10 | 5 |
| 10-20 | 10 |
20-30 | 4 |
| 30-40 | 6 |
40-50 | 7 |
| 50-60 | 3 |
60-70 | 2 |
| 70-80 | 2 |
80-90 | 3 |
| 90-100 | 9 |
Solution: In Fig. a histogram and a frequency polygon (in dotted lines) are drawn on the same scale.
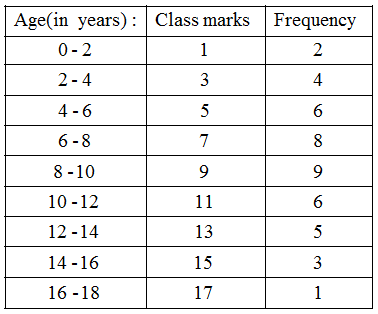
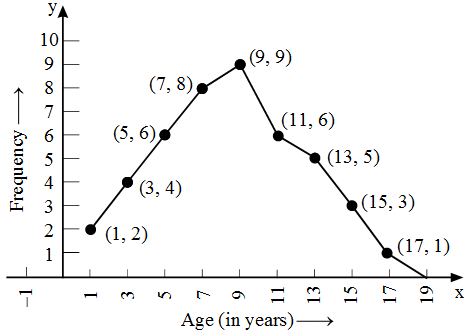
Example 2: Construct a frequency polygon for the following data :
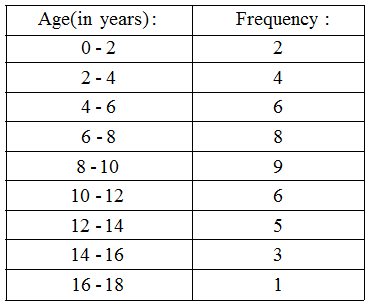
Solution: First we obtain the class marks as given in the following table.
Example 3: Prepare frequency polygon with the help of histogram from the following data :
Classes | 0-6 | 6-12 | 12-18 | 18-24 | 24-30 | 30-36 |
| Frequencies | 4 | 8 | 15 | 20 | 12 | 6 |
Solution: We plot the classes (-6-0), (0-6), (6-12), (12-18), (18-24), (24-30), (30-36) and (36-42) along the x-axis. The frequencies of these classes are respectively, 0, 4, 8, 15, 20, 12, 6 and 0. These frequencies are plotted along the y-axis.
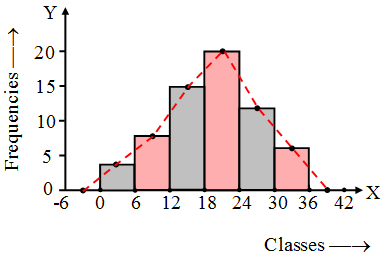
After drawing the histogram for the data, we join the mid-points of the top sides of the rectangles of the histogram. The frequency polygon is made with dotted line segments.
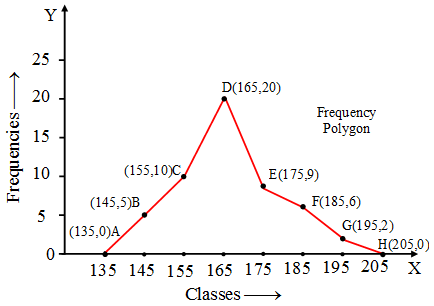
Example 4: Draw frequency polygon for the data given below, without drawing histogram :
Classes | 140-150 | 150-160 | 160-170 | 170-180 | 180-190 | 190-200 |
| Frequencies | 5 | 10 | 20 | 9 | 6 | 2 |
Solution: We have the classes 130-140, 140-150, 150-160, 160-170, 170-180, 180-190, 190-200, 200-210 having frequencies 0, 5, 10, 20, 9, 6, 2, 0 respectively.
The class marks of the classes are
\(\frac { 130+140 }{ 2 } =135,\frac { 140+150 }{ 2 } =145,….,\frac { 200+210 }{ 2 } =205\)
respectively.
We take class marks along x-axis and the frequencies along y-axis.
We plot the points (135, 0), (145, 5), (155, 10), (165, 20), (175, 9), (185, 6), (195, 2) and (205, 0). Now, we joint these points and get the required frequency polygon ABCDEFGH as in figure.
Example 5: Ages (in years) of the members of two sports clubs were recorded and the data collected is as under.
Age (in years) | Number of members of Club A | Number of members of Club B |
20-29 30-39 40-49 50-59 60-69 70-79 | 5 10 15 10 20 5 | 10 15 10 5 10 15 |
| Total | 65 | 65 |
Represent the ages of the members of the sports clubs A and B on the same graph by two frequency polygons. Compare the pattern of the two clubs according to ages of the members.
Solution: The class marks of the classes 20-29, 30-39, 40-49, 50-59, 60-69, 70-79 are 24.5, 34.5, 44.5, 54.5, 64.5, 74.5 respectively. The corresponding frequencies for clubs A and B are 5, 10, 15, 10, 20, 5 ; 10, 15, 10, 5, 10, 15 respectively.
For the club A, the frequency polygon is drawn by joining the points (14.5, 0), (24.5, 5), (34.5, 10), (44.5, 15), (54.5, 10), (64.5, 20), (74.5, 5), (84.5, 0).
For the club B, the frequency polygon is drawn by joining the points (14.5, 0), (24.5, 10), (34.5, 15), (44.5, 10), (54.5, 5), (64.5, 10), (74.5, 15,), (84.5, 0).
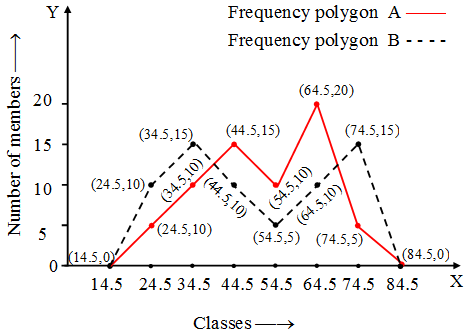
We observe that the club B is more youthful in comparison to club A.
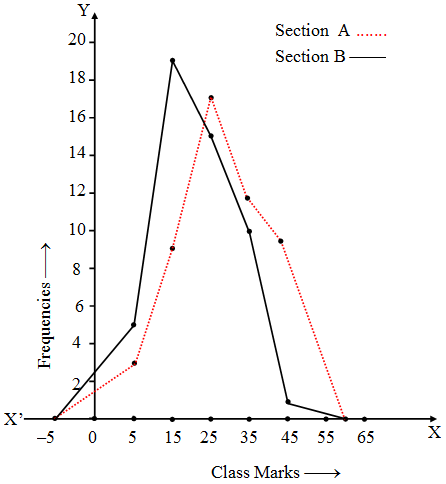
Example 6: The following table gives the distribution of students of two sections according to the marks obtained by them.
Section A | Section B | ||
Marks | Frequency | Marks | Frequency |
| 0-10 10-20 20-30 30-40 40-50 | 3 9 17 12 9 | 0-10 10-20 20-30 30-40 40-50 | 5 19 15 10 1 |
Represent the marks of the students of both the sections on the same graph by two frequency polygons. From the two polygons compare the performance of the two section.
Solution: Class marks for section A are : 5, 15, 25, 35, 45 and corresponding frequencies as 3, 9, 17, 12, 9 respectively.
Its frequency polygon is the join of the points (by line segments) (-5, 0), (5, 3), (15, 9), (25, 17), (35, 12), (45, 9) and (60, 0).
Similarly for the section B, the frequency polygon is the join of the points (-5, 0),
(5, 5), (15, 19), (25, 15), (35, 10), (45, 1) and (60, 0).
We draw the two frequency polygon :
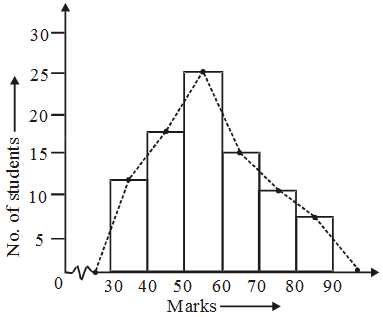
Example 7: Make a histogram and a frequency polygon from the given data :
| Marks | No. of students |
| 30-40 | 12 |
| 40-50 | 18 |
| 50-60 | 26 |
| 60-70 | 16 |
| 70-80 | 10 |
| 80-90 | 6 |
Solution: The frequency polygon has been shown by dotted lines