What is the Mode in Statistics
Mode is also known as norm.
Mode is the value which occurs most frequently in a set of observations and around which the other items of the set cluster density.
Algorithm
Step I : Obtain the set of observations.
Step II : Prepare the frequency distribution.
Step III : Obtain the value which has the maximum frequency.
Step IV : The value obtained in step III is the mode.
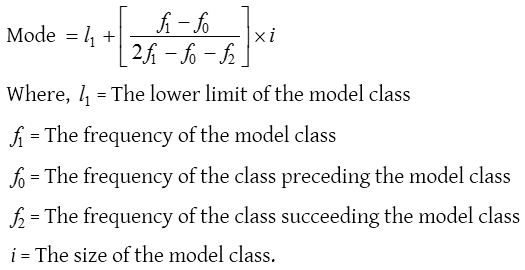
The mode or model value of a distribution is that value of the variable for which the frequency is maximum. For continuous series, mode is calculated as,
Symmetric distribution: A distribution is a symmetric distribution if the values of mean, mode and median coincide. In a symmetric distribution frequencies are symmetrically distributed on both sides of the centre point of the frequency curve.
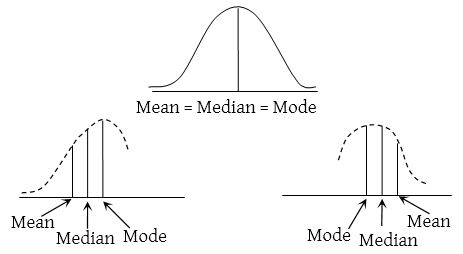
A distribution which is not symmetric is called a skewed-distribution. In a moderately asymmetric distribution, the interval between the mean and the median is approximately one-third of the interval between the mean and the mode i.e., we have the following empirical relation between them,
Mean – Mode = 3(Mean – Median)
⇒ Mode = 3 Median – 2 Mean.
It is known as Empirical relation.
Relative characteristics of mean, median and mode
- Mean is usually understood as arithmetic average, since its basic definition is given in arithmetical terms.
- Mean is regarded as the true representative of the whole population since in its calculation all the values are taken into consideration. It does not necessarily assume a value that is the same as one of theoriginal ones (which other averages often do).
- Mean is suitable for sets of data which do not have extreme values. In other cases, median is the appropriate measure of location.
- Mode is the most useful measure of location when the most common or most popular item is required.
Read More:
- How are Bar Graphs and Histograms Related
- Bar Graph in Statistics
- Median of Grouped Frequency Distribution
- Mean and its Advantages and Disadvantages
- Pie Charts
- Frequency Polygon
https://www.youtube.com/watch?v=hp6MEaYX9SU&t=24s
Merits of Mode
- Mode is readily comprehensively and easy to calculate. It can be located in some cases morely by inspection.
- Mode is not all affected by extreme values.
- Mode can be coneniently even class interval of unequal magnitude.
Demerits of Mode
- Mode is ill defined. In some cases we may come across two modes.
- It is not based upon all the observations.
- No further mathematical treatment is possible in case of mode.
- Mode is affected to a greater extant by flutuations of sampling.
Relationship among Mean, Median and Mode :
Following are the relations,
- Mode = 3 Median – 2 mean
- Median = Mode + \(\frac{2}{3}\) (Mean – Mode
- Mean = Mode + \(\frac{3}{2}\) (Median – Mode)
Mode in Statistics Example Problems with Solutions
Example 1: Find the mode from the following data :
110, 120, 130, 120, 110, 140, 130, 120, 140, 120.
Solution: Arranging the data in the form of a frequency table, we have
| Value | Tally bars | Frequency |
| 110 | | | | 2 |
| 120 | | | | | | 4 |
| 130 | | | | 2 |
| 140 | | | | 2 |
Since the value 120 occurs maximum number of times i.e. 4. Hence, the modal value is 120.
Example 2: Find the mode for the following series :
2.5, 2.3, 2.2, 2.2, 2.4, 2.7, 2.7, 2.5, 2.3, 2.2, 2.6, 2.2
Solution: Arranging the data in the form of a frequency table, we have
| Value | Tally bars | Frequency |
| 2.2 | | | | | | 4 |
| 2.3 | | | | 2 |
| 2.4 | | | 1 |
| 2.5 | | | | 2 |
| 2.6 | | | 1 |
| 2.7 | | | | 2 |
We see that the value 2.2 has the maximum frequency i.e. 4.
So, 2.2 is the mode for the given series.
Example 3: Compute mode for the following data.
7, 7, 8, 8, 8, 9, 9, 10, 10, 10, 11, 11, 12, 13, 13
Solution: Here, both the scores 8 and 10 occurs thrice (maximum number of times). So, we apply the empirical formula.
Here,
mean = \(\frac{{7 \times 2 + 8 \times 3 + 9 \times 2 + 10 \times 3 + 11 \times 2 + 12 + 13 \times 2}}{{2 + 3 + 2 + 3 + 2 + 1 + 2}}\)
= \(\frac{{14 + 24 + 18 + 30 + 22 + 12 + 26}}{{15}}\) = \(\frac{{146}}{{15}}\)
=9.73
No. of scores = 15 (odd)
∴ Median = \({t_{\frac{{15 + 1}}{2}}}\) = t8 = 10
∴ Mode = 3 median – 2 mean
= 3 × 10 – 2 × 9.73 = 30 – 19.46 = 10.54
Example 4: Find the mode of the following data :
6, 4, 7, 4, 5, 8, 4, 5, 5, 3, 2, 5
Solution: We write the data in tabular form :
| x | f |
| 2 | 1 |
| 3 | 1 |
| 4 | 3 |
| 5 | 4 |
| 6 | 1 |
| 7 | 1 |
| 8 | 1 |
We observe that 5 has maximum frequency which is 4
⇒ Mode = 5
Example 5: The following table gives the weights of 40 men. Calculate mode.
| Weights (in kg) | Number of men |
| 54 | 6 |
| 72 | 6 |
| 80 | 1 |
| 64 | 2 |
| 62 | 6 |
| 60 | 5 |
| 58 | 5 |
| 56 | 4 |
| 63 | 5 |
Solution: Here, each of the scores 54, 72 and 62 occurs maximum number of times (six times). So we apply the empirical formula.
We construct the following table :
| Weights x | No. of men f | Cumulative frequency | Product f.x |
| 54 | 6 | 6 | 324 |
| 56 | 4 | 10 | 224 |
| 58 | 5 | 15 | 290 |
| 60 | 5 | 20 | 300 |
| 62 | 6 | 26 | 372 |
| 63 | 5 | 31 | 315 |
| 64 | 2 | 33 | 128 |
| 72 | 6 | 39 | 432 |
| 80 | 1 | 40 | 80 |
| Total | 40 | 2465 |
Mean = \(\frac{{\Sigma f.x}}{{\Sigma f}}\) = \(\frac{{2465}}{{40}}\) = 61.625
Here, No. of scores = 40 (even)
Median = \(\frac{{{t_{20}} + {t_{21}}}}{2}\) = \(\frac{{60 + 62}}{2}\) = 61
∴ Mode = 3 median – 2 mean
= 3 × 61 – 2 × 61.625
= 183 – 123.25 = 59.75
Thus, modal weight = 59.75 kg
Example 6: If mean = 60 and median = 50, find mode.
Solution: We have,
Mean = 60, Median = 50
Mode = 3 Median – 2 Mean
= 3 (50) – 2 (60) = 30
Example 7: If mode = 70 and mean = 100, find median.
Solution: We have, Mode = 70, Mean = 100
Median = Mode + (Mean – Mode)
= 70 + (100 – 70)
= 70 + 20
= 90
Example 8: If mode = 400 and median = 500, find mean.
Solution: Mean = Mode + (Median – Mode)
= 400 + (500 – 400)
= 400 + (100)
= 400 + 150
= 550
Example 9: Find the mode of the data 3, 2, 5, 2, 3, 5, 6, 6, 5, 3, 5, 2, 5.
Solution: Since 5 is repeated maximum number of times, therefore mode of the given data is 5.
Example 10: If the value of mode and mean is 60 and 66 respectively, then find the value of median.
Solution: Mode = 3 Median – 2 mean
∴ Median = \(\frac{1}{3}\) (mode + 2 mean)
= \(\frac{1}{3}\) (60 + 2 × 66) = 64