ICSE Solutions for Class 10 Mathematics – Statistics
ICSE SolutionsSelina ICSE Solutions
Get ICSE Solutions for Class 10 Mathematics Chapter 19 Statistics for ICSE Board Examinations on APlusTopper.com. We provide step by step Solutions for ICSE Mathematics Class 10 Solutions Pdf. You can download the Class 10 Maths ICSE Textbook Solutions with Free PDF download option.
Download Formulae Handbook For ICSE Class 9 and 10
Formulae
- Mean:
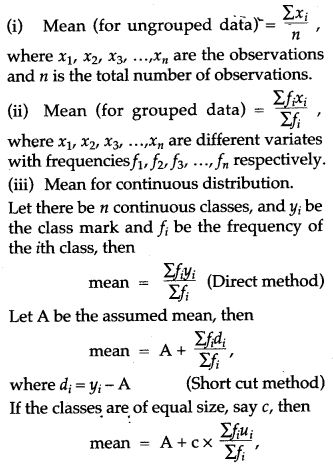
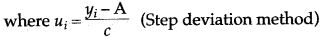
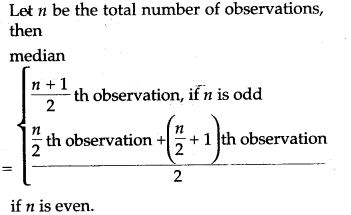
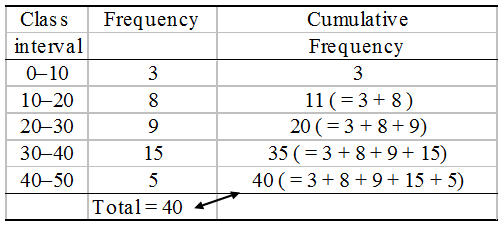
- Median:
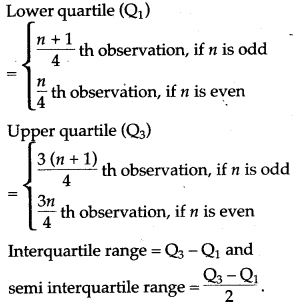
- Quartiles:
Formulae Based Questions
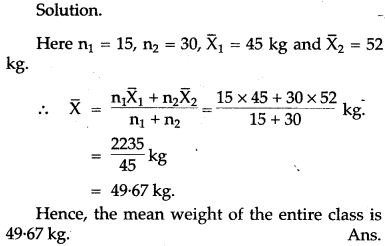
Question 1. There are 45 students in a class, in which 15 are girls. The average weight of 15 girls is 45 kg and 30 boys is 52 kg. Find the mean weight in kg of the entire class.
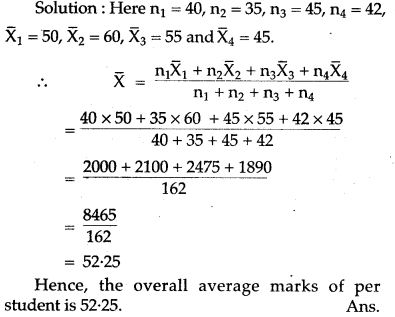
Question 2. A school has 4 sections of Chemistry in class X having 40, 35, 45 and 42 students. The mean marks obtained in Chemistry test are 50, 60, 55 and 45 respectively for the 4 sections. Determine the overall average of marks per student.
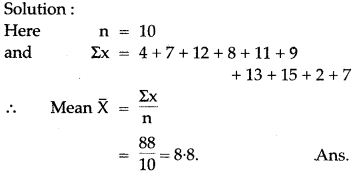
Question 3. Find the mean of 4, 7, 12, 8, 11, 9, 13, 15, 2, 7.
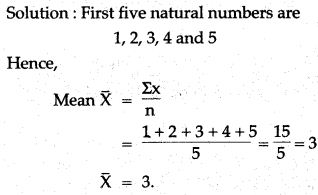
Question 4. Find the mean of first five natural numbers.
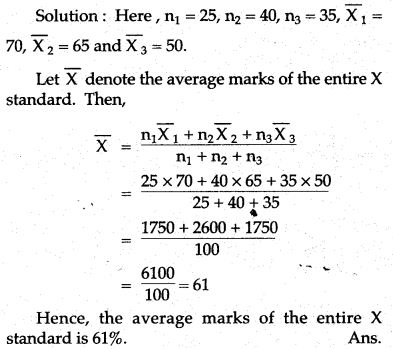
Question 5. In X standard, there are three sections A, B and C with 25, 40 and 35 students respectively. The average marks of section A is 70%, section B is 65% and of section C is 50%. Find the average marks of the entire X standard.
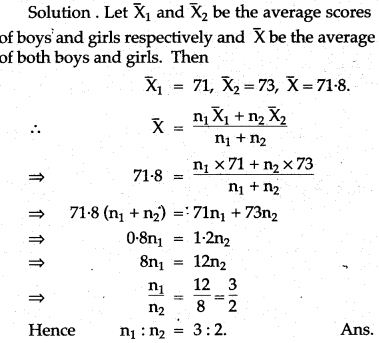
Question 6. The average score of boys in an examination of a school is 71 and of girls is 73. The averages score of school in that examination is 71.8. Find the ratio of the number of boys between number of girls appeared in the examination.
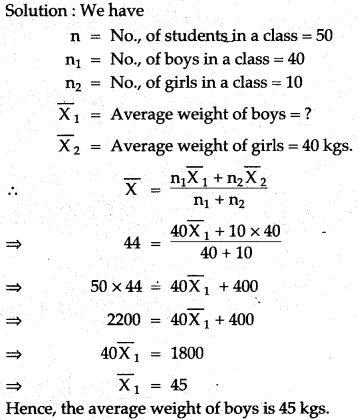
Question 7. There are 50 students in a class in which 40 are boys and rest are girls. The average weight of the class is 44 kgs and the average weight of the girls is 40 kgs. Find the average weight of the boys.
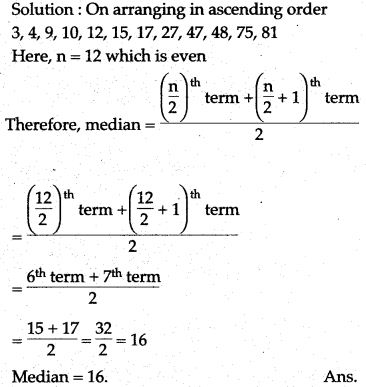
Question 8. From the following numbers find the median:
10, 75, 3, 81, 17, 27, 4, 48, 12, 47, 9, 15.
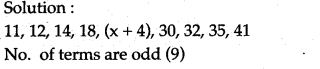
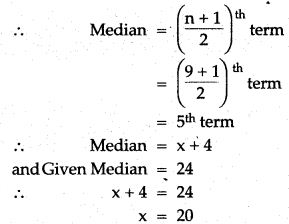
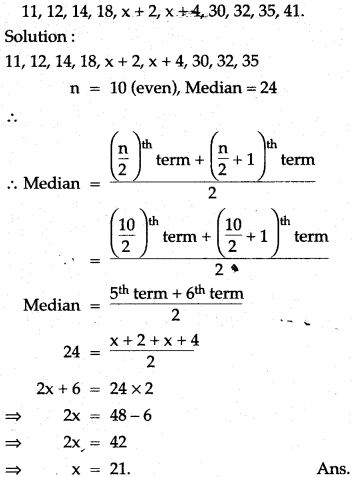
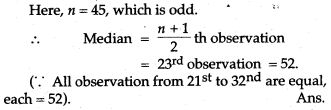
Question 9. The median of the following observation 11, 12, 14, 18, (x + 4), 30, 32, 35, 41 arranged in ascending order is 24. Find x.
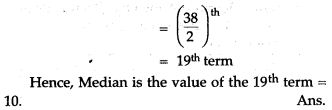
Question 10. The median of the following observations arranged in ascending order is 24. Find x:
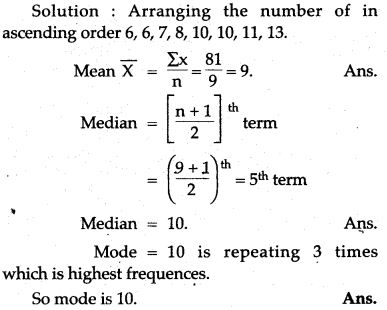
Question 11. Find the mean, median and mode of the following distribution:
8,10, 7, 6,10,11, 6,13,10
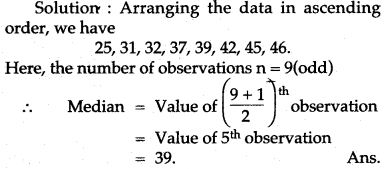
Question 12. Find the median of the following values:
37, 31, 42, 43, 46, 25, 39, 45, 32.
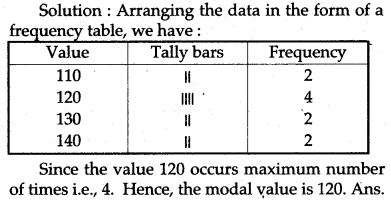
Question 13. Find the mode from the following data:
110,120,130,120,110,140,130,120,140,120.
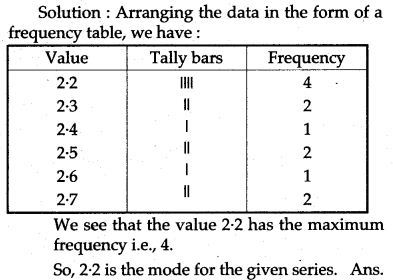
Question 14. Find the mode for the following series:
2.5, 2.3, 2.2, 2.2, 2.4, 2.7, 2.7, 2.5, 2.3, 2.2, 2.6, 2.2.
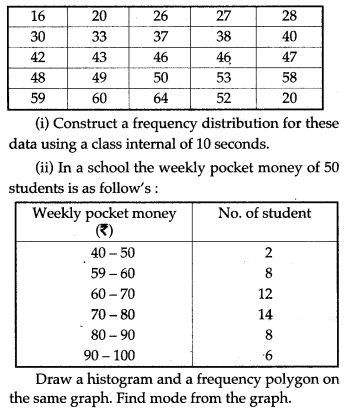
Question 15. Find out the mode from the following data:
Data Based Questions
Question 1. The contents of 100 match box were checked to determine the number of match sticks they contained.
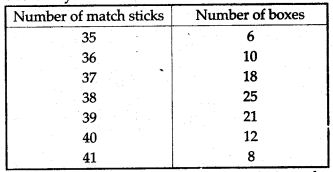
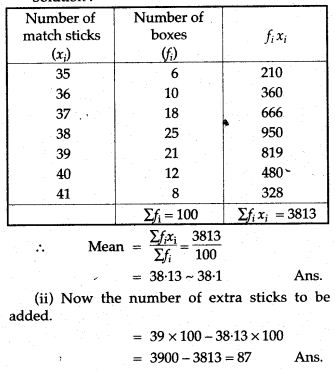
(i) Calculate correct to one decimal place, the mean number of match sticks per box.
(ii) Determine how many matchsticks would have to be added. To the total contents of the 100 boxes to bring the mean up exactly 39 match sticks.
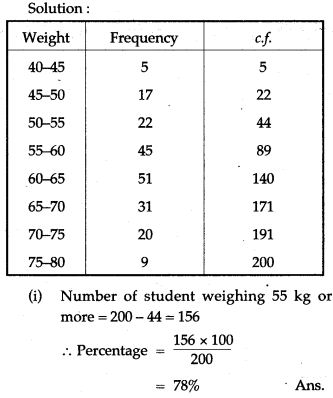
Solution:
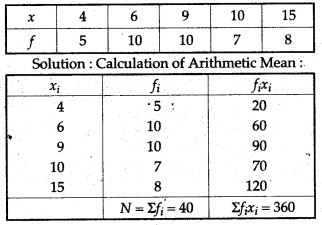
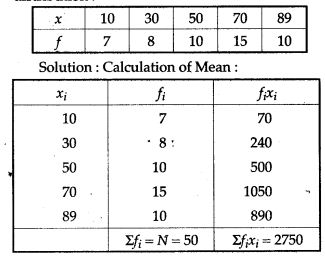
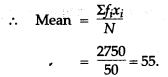
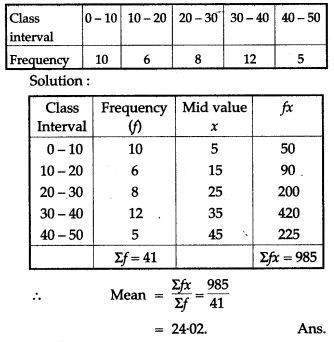
Question 2. Find the mean of the following distribution:
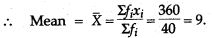
Question 3. The mean of the following distribution is 6. Find the value at P:
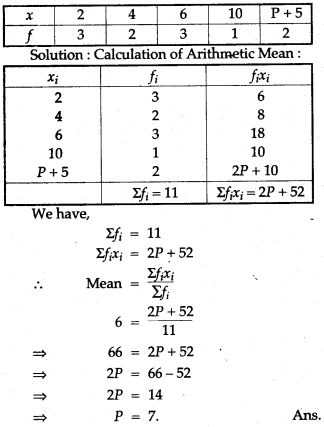
Question 4. If the mean of the following distribution is 7.5, find the missing frequency ‘f’:
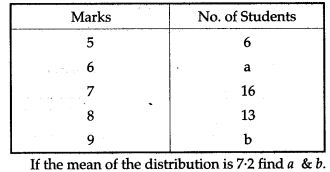
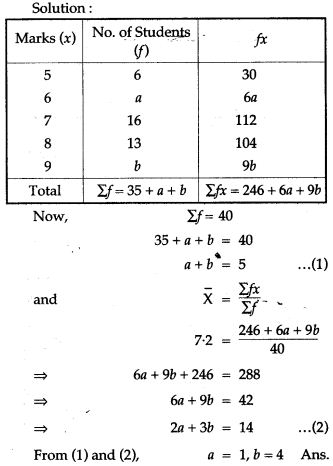
Question 5. Marks obtained by 40 students in a short assessment is given below; where a and b are two missing data.
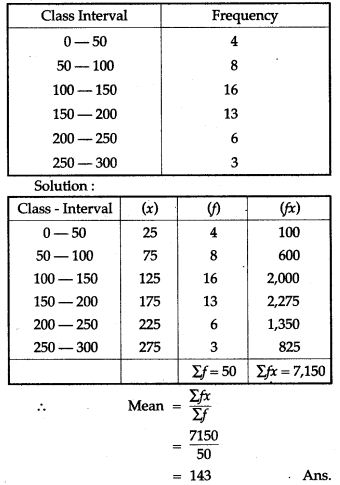
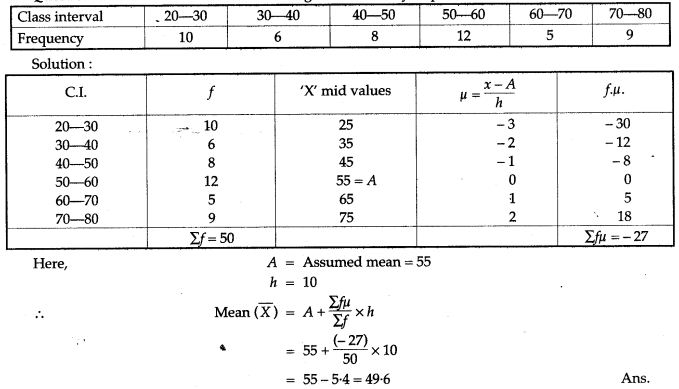
Question 6. Find the mean of the following distribution:
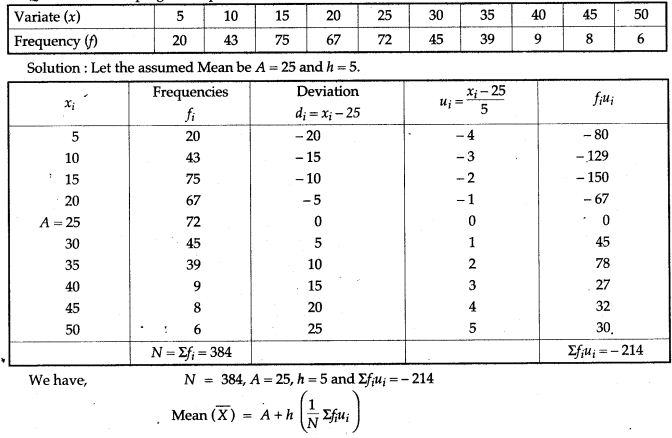
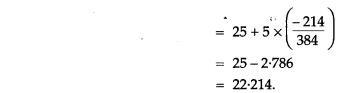
Question 7. Find the mean of the following distribution:
Question 8. Find the mean of the following frequency distribution:
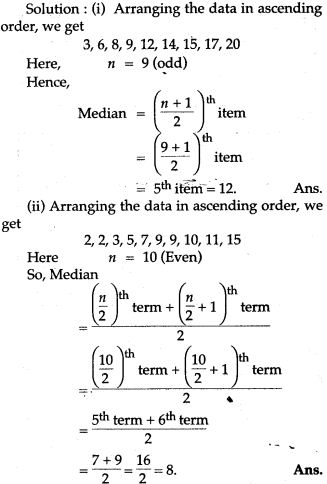
Question 9. Find the Median of the following data:
(i) 12,17, 3,14, 6, 9,8,15,20
(ii) 2,10,9,9,5,2,3,7,11,15.
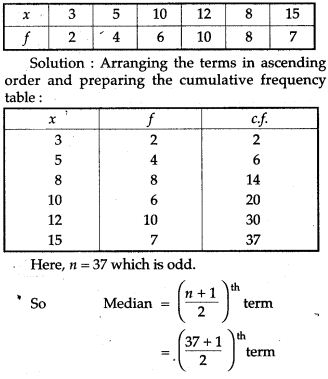
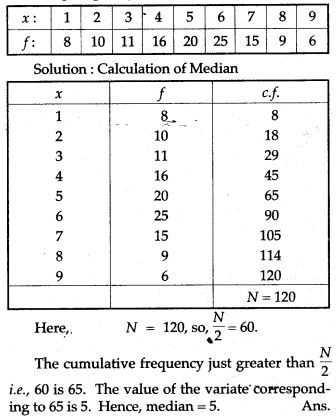
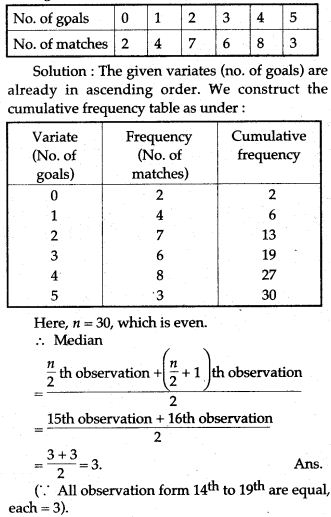
Question 10. Find the Median of the following distribution:
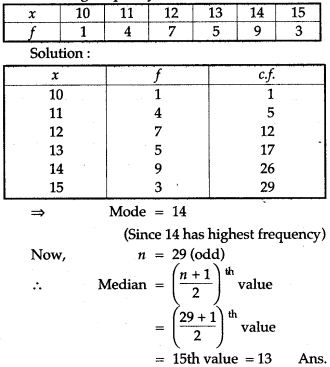
Question 11. Find the mode and median of the following frequency distribution:
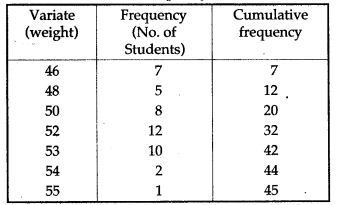
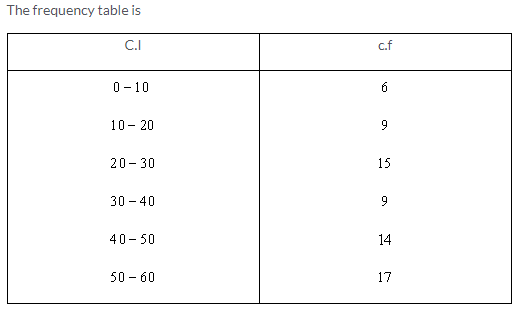
Question 12. Calculate the median of the following distribution:
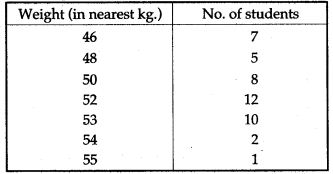
Solution: The given variates (weights of students) are already in ascending order. We construct the cumulative frequency table as under:
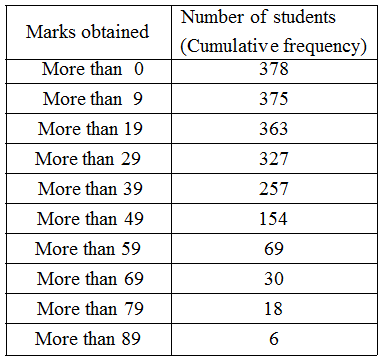
Question 13. Obtain the median for the following frequency distribution:
Question 14. Calculate the median of the following distribution:
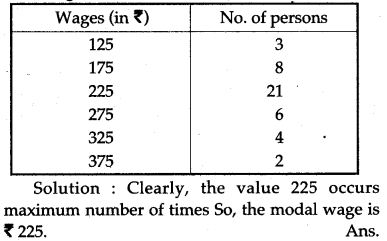
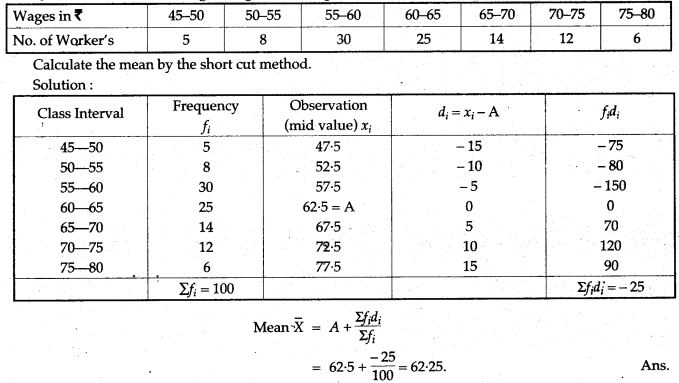
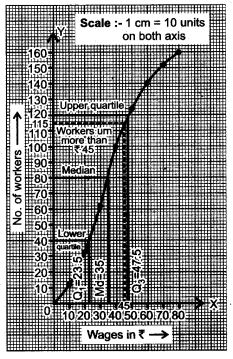
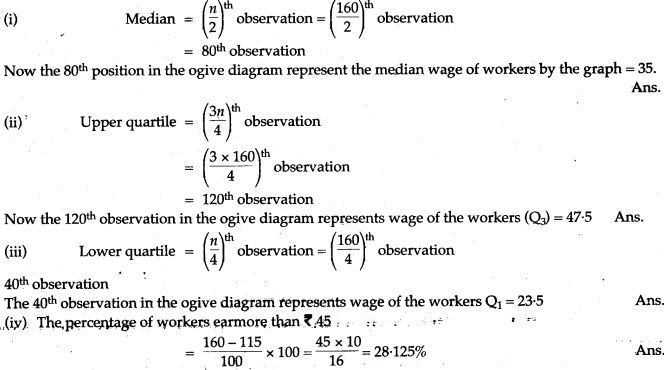
Question 15. The following table gives the wages of worker in a factory:
Question 16. The following table shows the weight of 12 students:
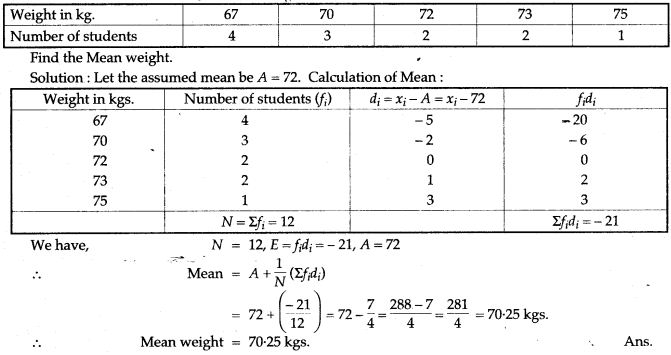
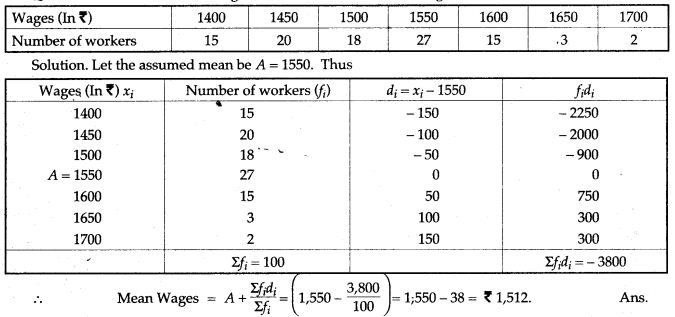
Question 17. Find the mean wage of a worker from the following data:
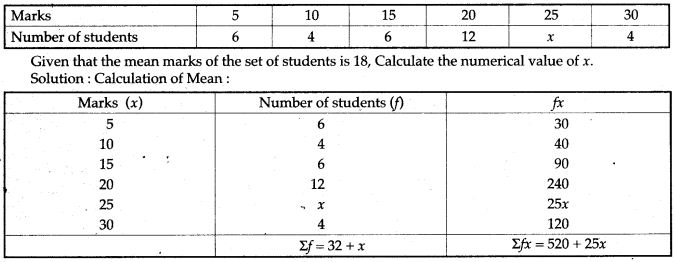
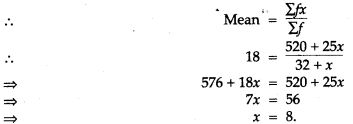
Question 18. The marks obtained by a set of students in an examination all given below:
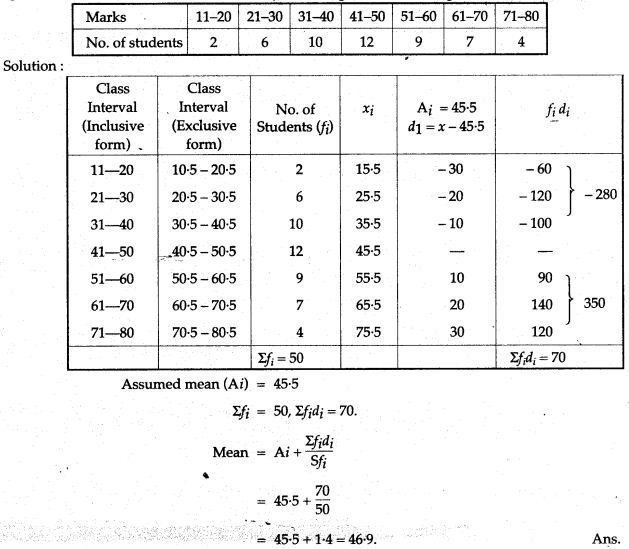
Question 19. Find the mean of the following distribution by step deviation method:
Question 20. Helping the step deviation method find the arithmetic mean of the distribution:
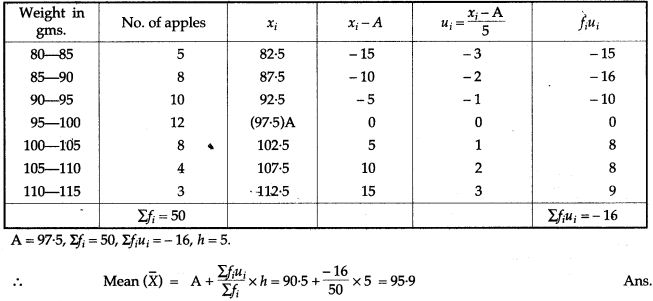
Question 21. The weights of 50 apples were recorded as given below. Calculate the mean weight, to the nearest gram. by the Step Deviation Method.
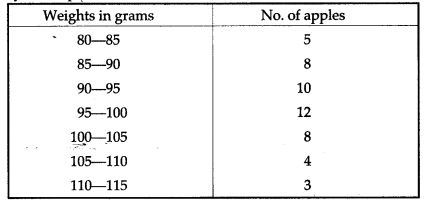
Solution:
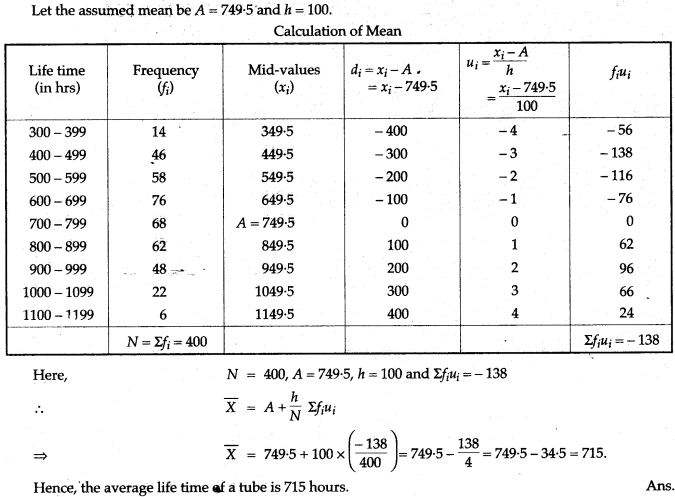
Question 22. A frequency distribution of the life times of 400 T.V., picture tubes leased in tube company is given below. Find the average life of tube:
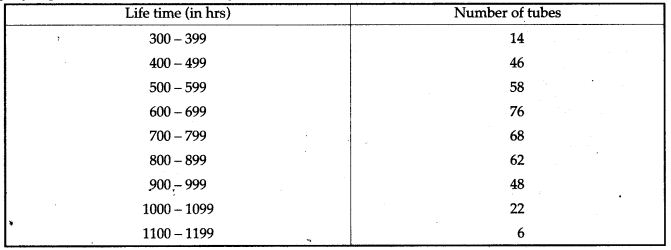
Solution: Here, the class-intervals are formed by exclusive method. If we make the series an inclusive one the mid-values remain same. So, there is no need to convert the series.
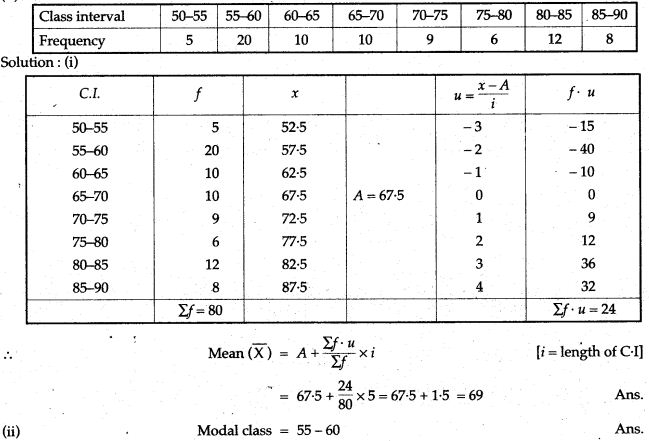
Question 23. (i) Using step-deviation method, calculate the mean marks of the following distribution, (ii) State the modal class.
Question 24. Calculate the mean of the distribution given below using the short cut method.
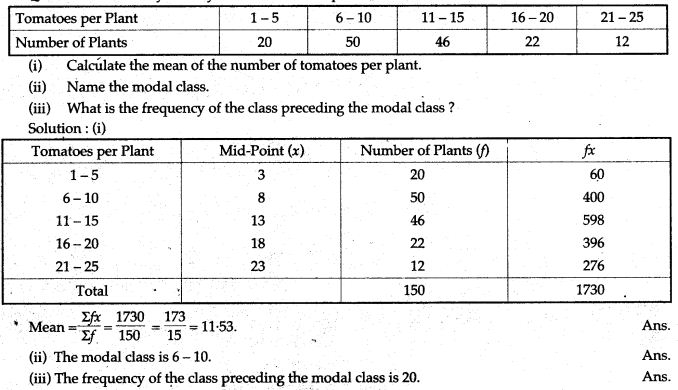
Question 25. A study of the yield of 150 tomato plants, resulted in the record:
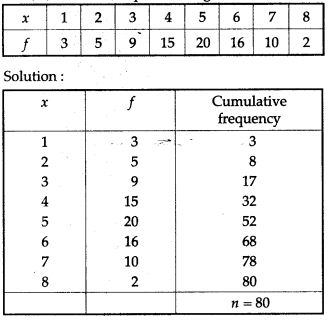
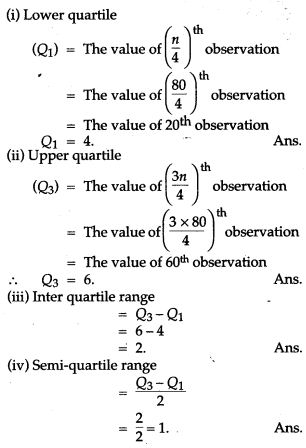
Question 26. For the following frequency distribution find:
(i) Lower quartile
(ii) Upper quartile
(iii) Inter quartile range
(iv) Semi-inter quartile range.
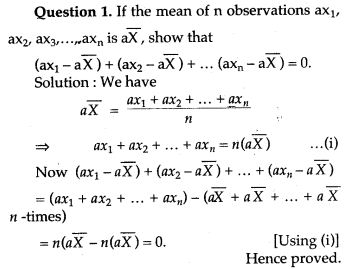
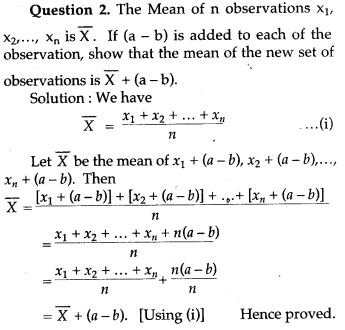
Prove the Following
Graphical Depiction
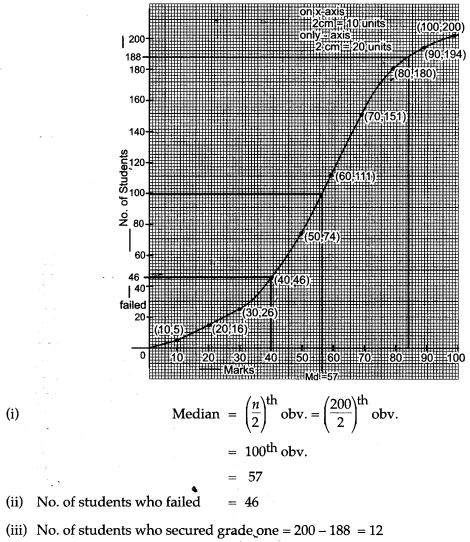
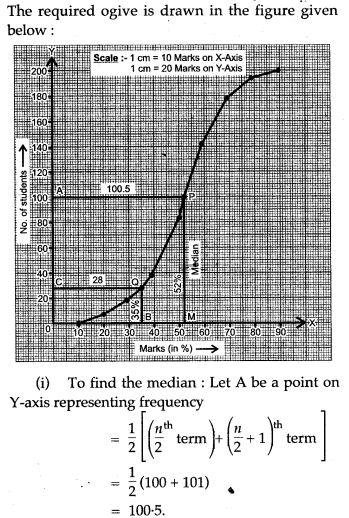
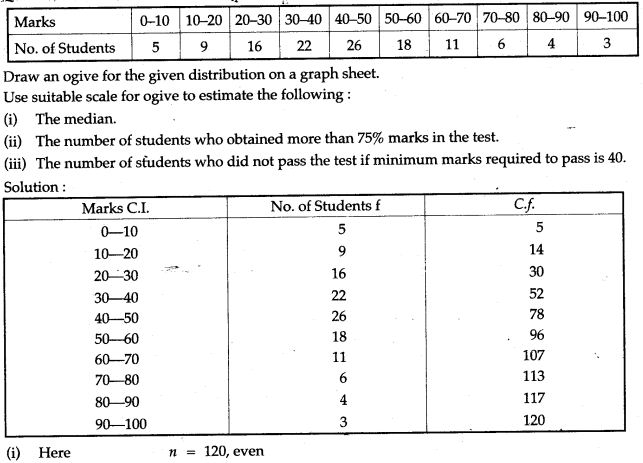
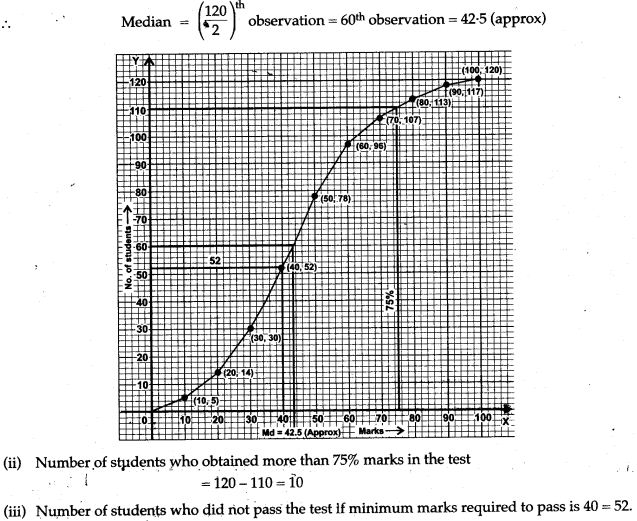
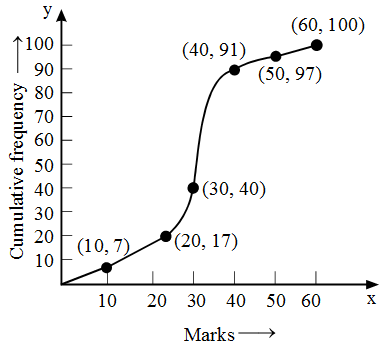
Draw an ogive for the given distribution taking 2 cm = 10 marks on one axis and 2 cm = 20 students on the other axis. Using the graph, determine:
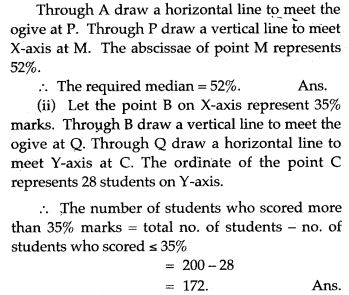
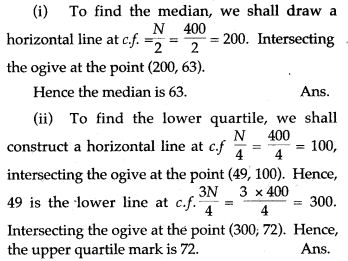
(i) The median marks
(ii) The number of students who failed if minimum marks required to pass is 40.
(iii) If scoring 85 and more marks is considered as grade one, find the number of students who secured grade one in the examination.
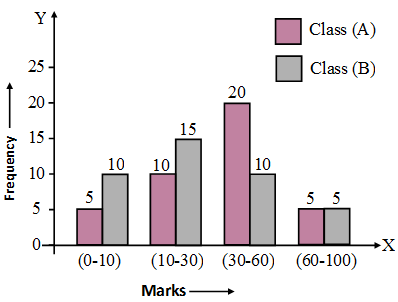
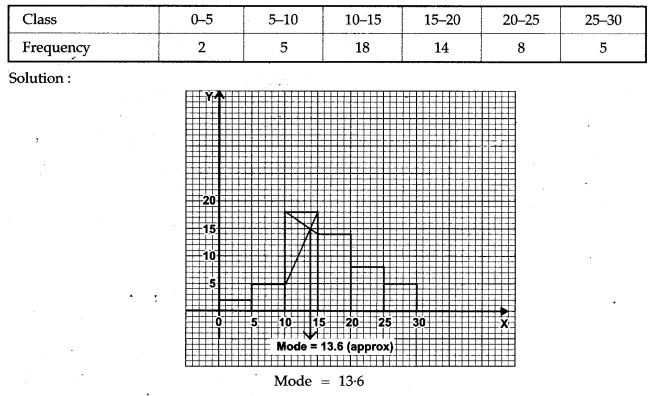
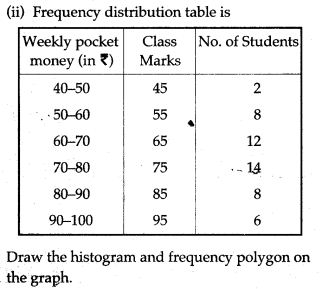
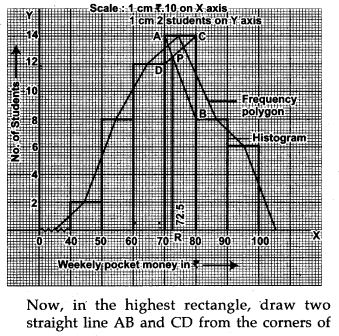
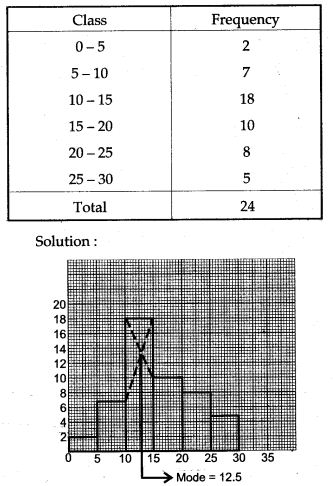
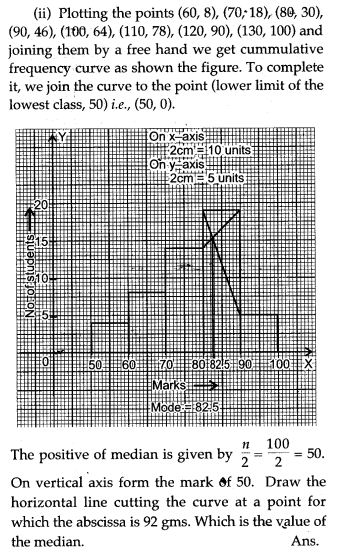
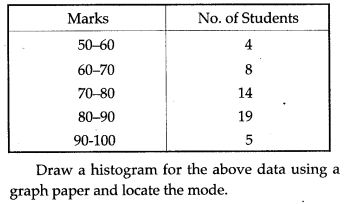
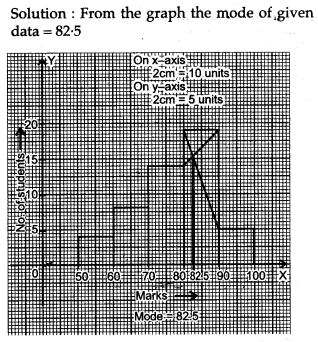
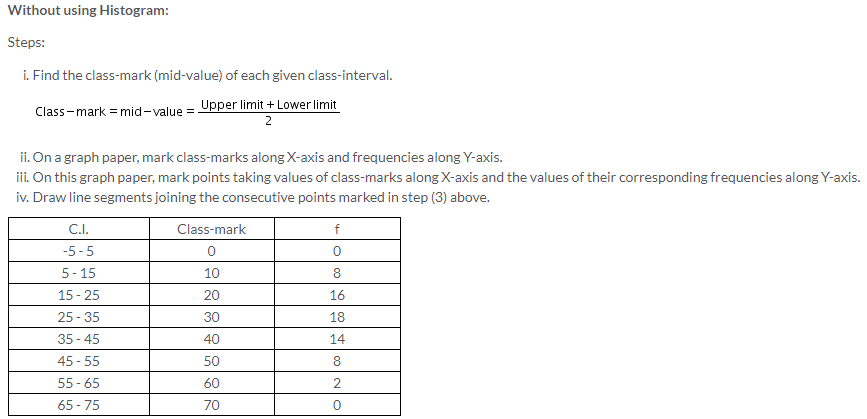
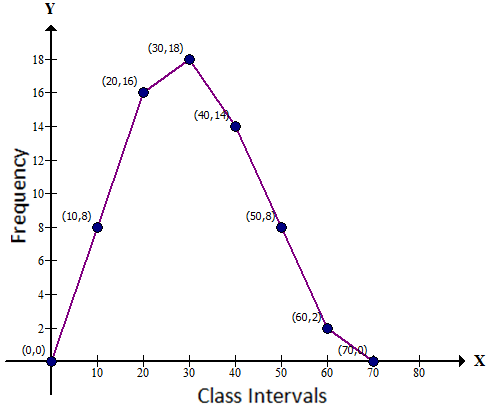
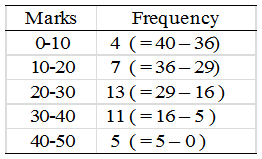
Question 2. Draw a histogram from the following frequency distribution and find the mode from the graph:
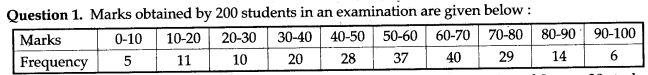
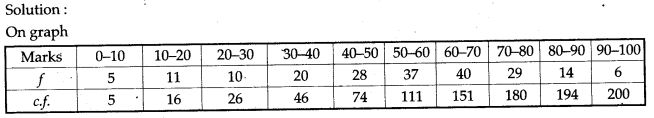
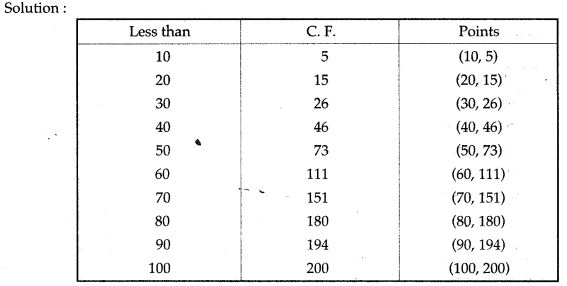
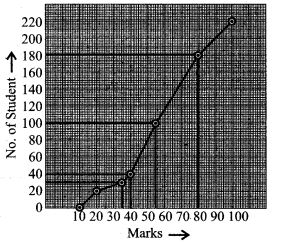
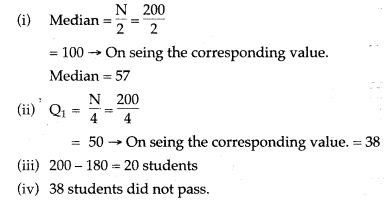
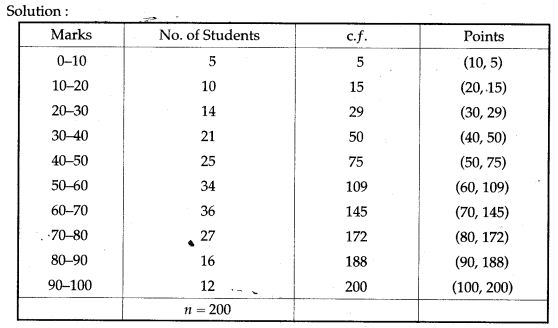
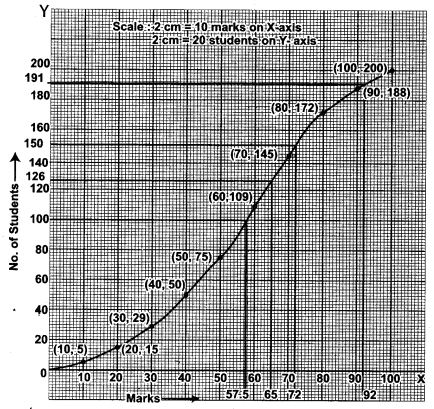
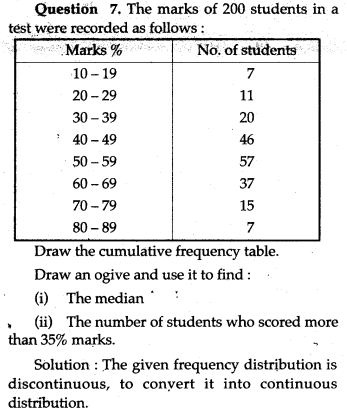
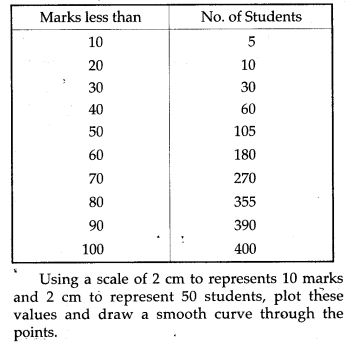
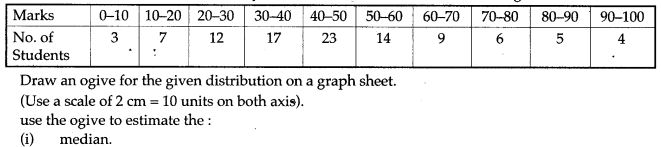
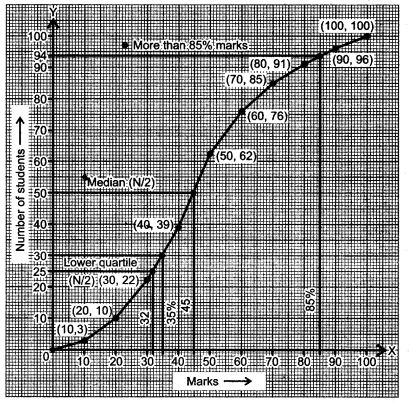
Question 3. The marks obtained by 200 students in an examination are given below:
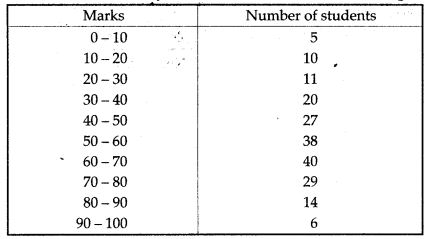
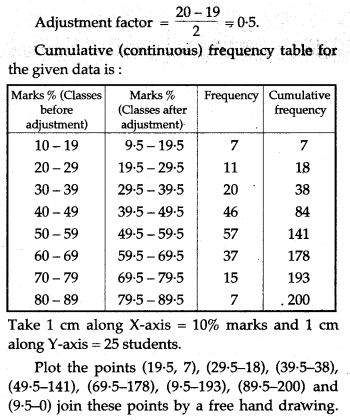
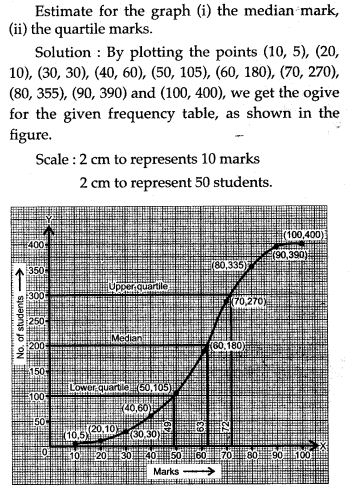
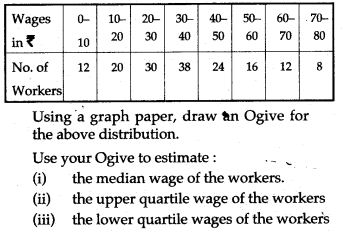
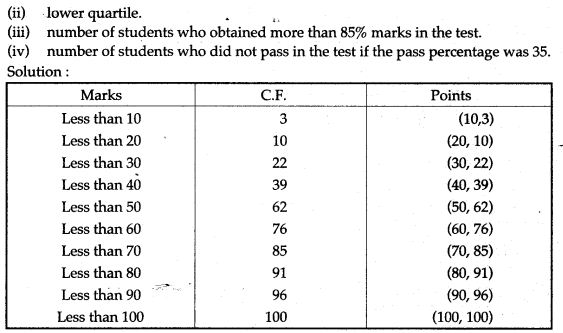
Using a graph paper, draw an Ogive for the above distribution. Use your Ogive to estimate:
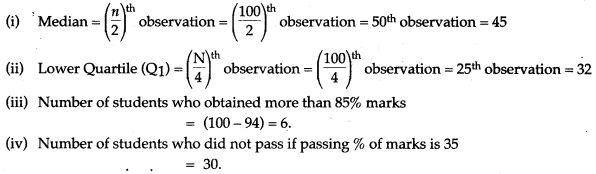
(i) the median; (ii) the lower quartile;
(iii) the number of students who obtained more than 80% marks in the examination and
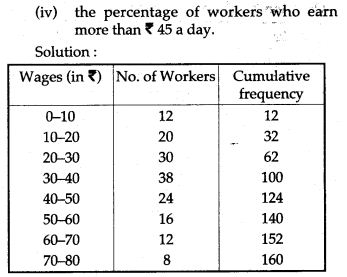
(iv) the number of students who did not pass, if the pass percentage was 35.
Use the scale as 2 cm = 10 marks on one axis and 2 cm = 20 students on the other axis.
Question 4. The following table give the marks scored by students in an examination:
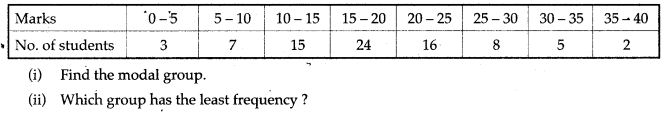
Solution: (i) 15 – 20 is the modal group.
(ii) The group 35 – 40 has the least frequency.
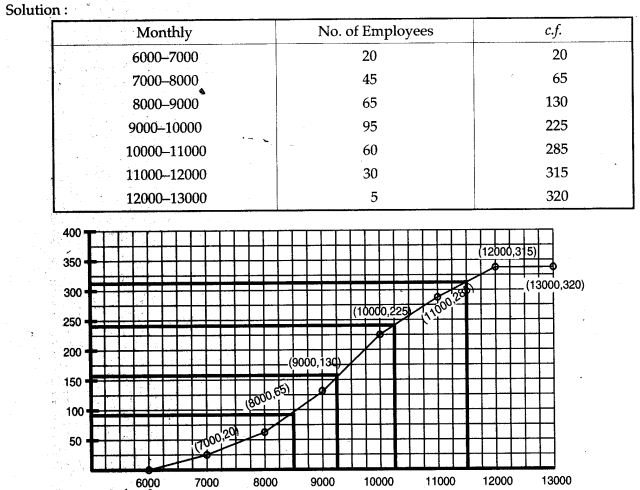
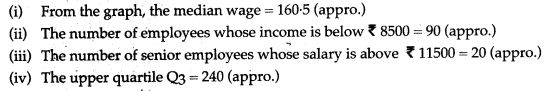
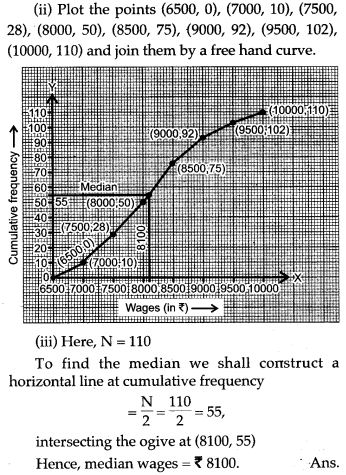
Questions 5. The monthly income of a group of 320 employees in a company is given below:
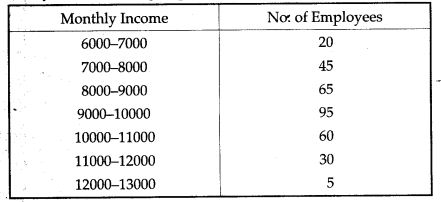
Draw an ogive of the given distribution on a graph sheet taking 2 cm = Rs. 1000 on one axis and 2 cm = 50 employees on the other axis. From the graph determine:
(i) the median wage
(ii) the number of employees whose income is below Rs. 8,500.
(iii) If the salary of a senior employee is above Rs. 11,500, find the number of senior employees in the company.
(iv) the upper quartile.
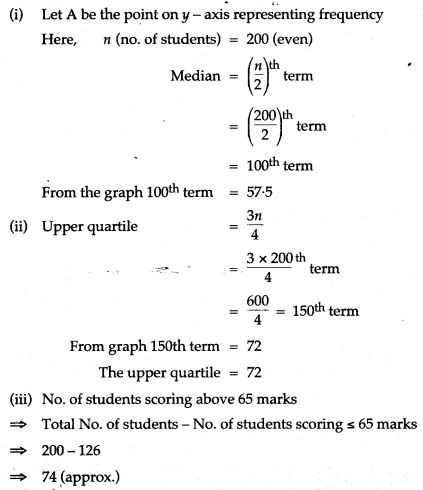
Question 6. Attempt this question on graph paper. Marks obtained by 200 students in examination are given below:

Draw an ogive for the given distribution taking 2 cm = 10 makrs on one axis and 2 cm = 20 students on the other axis.
From the graph find:
(i) the median
(ii) the upper quartile
(iii) number of student scoring above 65 marks.
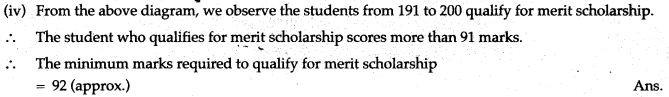
(iv) If to students qualify for merit scholarship, find the minimum marks required to qualify.
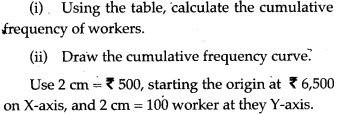
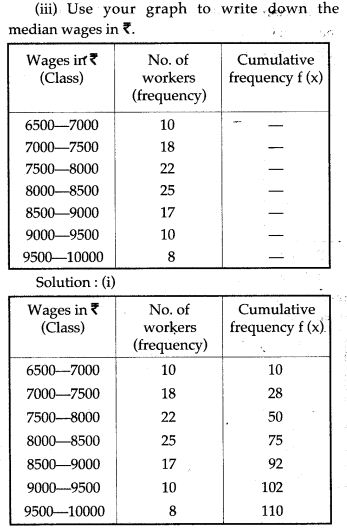
Question 8. Use graph paper for this question.
The table given below shows the monthly wages of some factory workers.
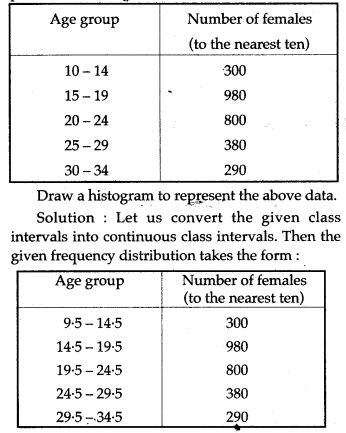
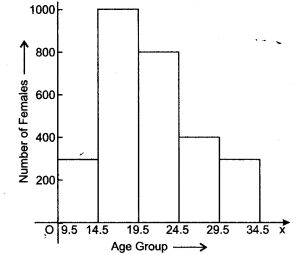
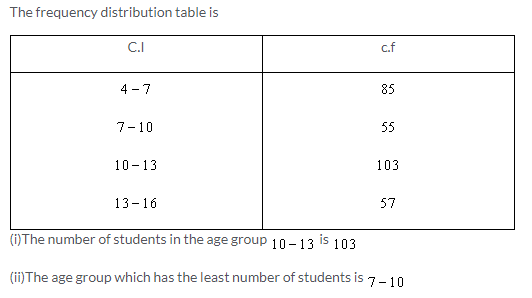
Question 9. Following table present educational level (middle stage) of females in Arunachal pradesh according to 1981 census:
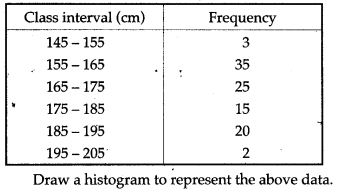
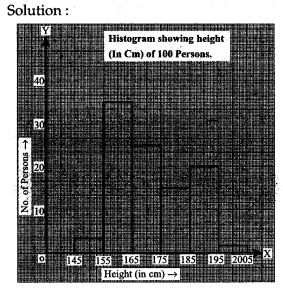
Question 10. Distribution of height in cm of 100 people is given below:
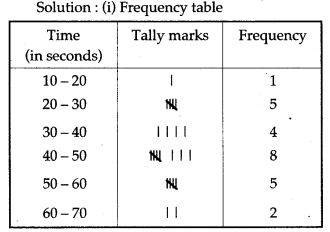
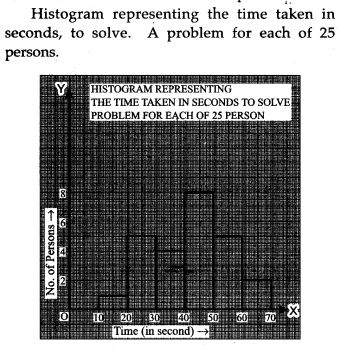
Question 11. The time taken, in seconds, to solve a problem for each of 25 persons is as follows:
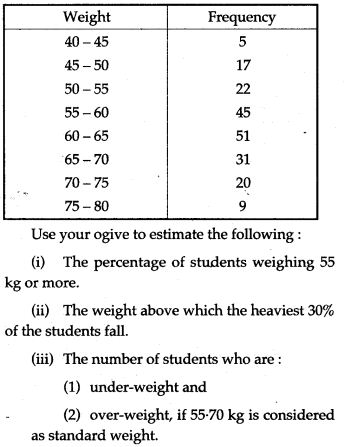
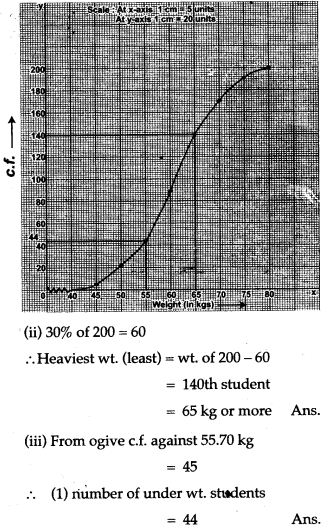
Question 12. Using a graph paper, drawn an Ogive for the following distribution which shows a record of the weight in kilograms of 200 students.
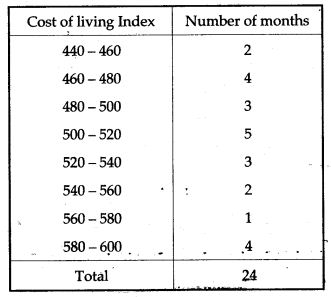
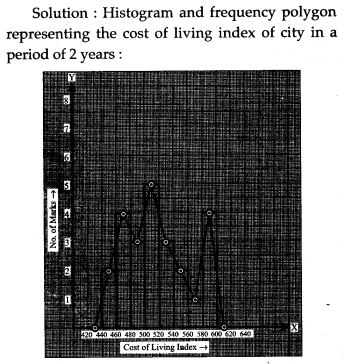
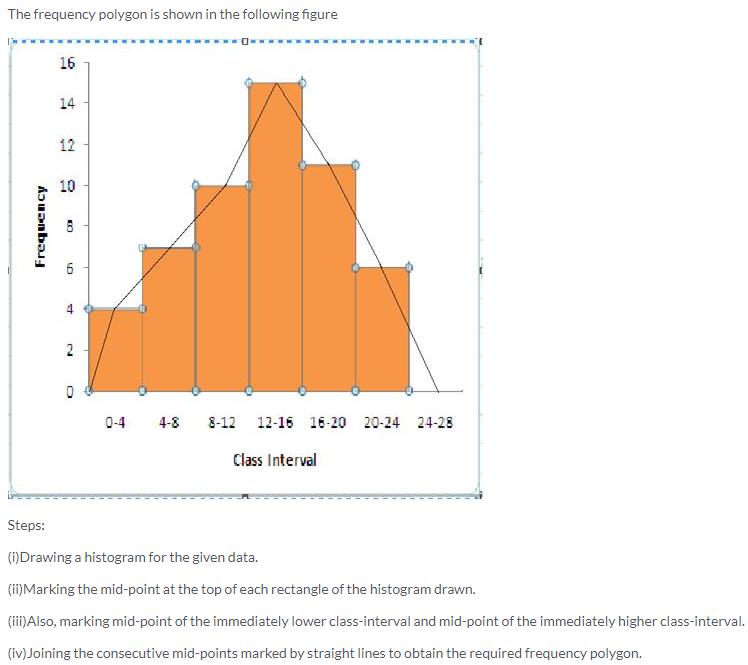
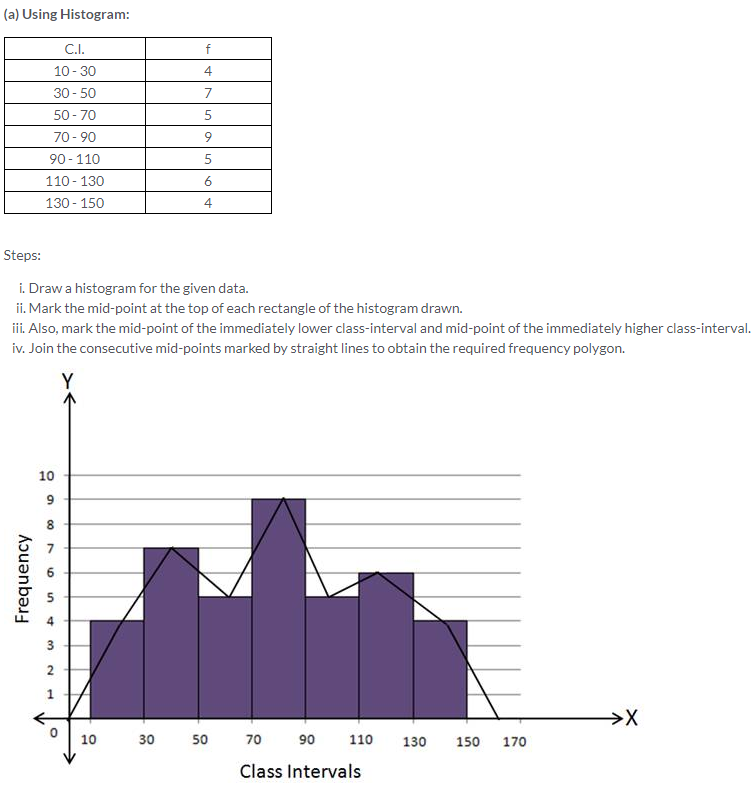
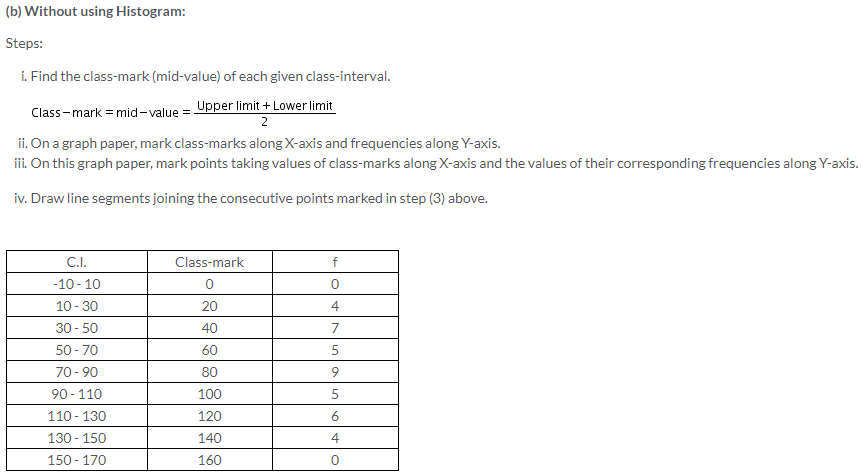
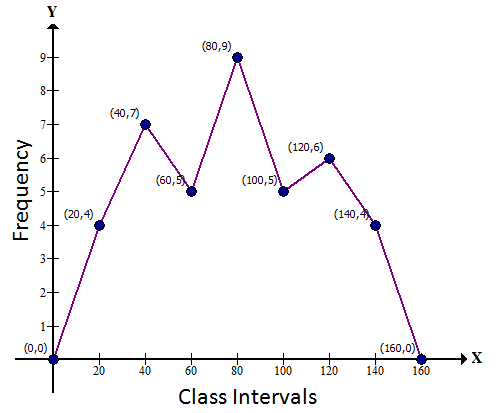
Question 13. Draw a histogram and frequency polygon to represent the following data (on the same scale) which shows the monthly cost of living index of a city in a period of 2 years:
Question 14. Draw the histogram for the following frequency distribution and hence estimate the mode for the distribution.
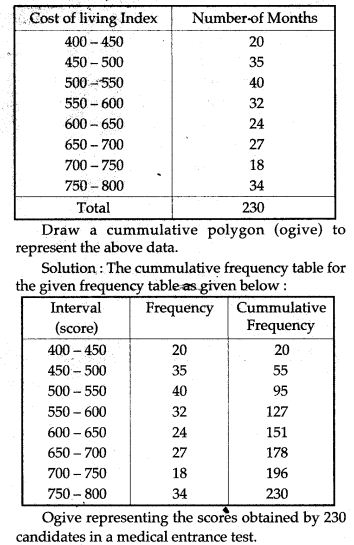
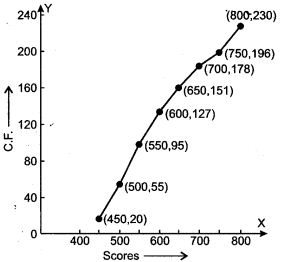
Question. 15. The frequency distribution of scores obtained by 230 candidates in a medical entrance test is as ahead:
Question 16. Draw a histogram to represent the following data:
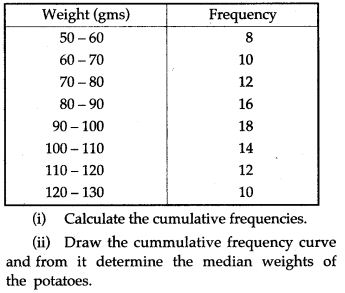
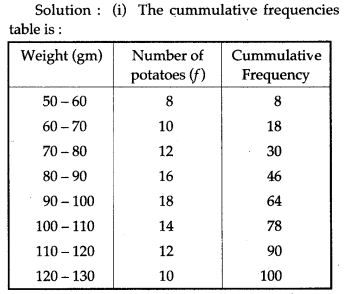
Question 17. Use graph paper for this question. The following table shows the weights in gm of a sample of 100 potatoes taken from a large consignment:
Question 18. Attempt this question on a graph paper. The table shows the distribution of marks gained by a group of 400 students in an examination:
Question 19. A Mathematics aptitude test of 50 students was recorded as follows:
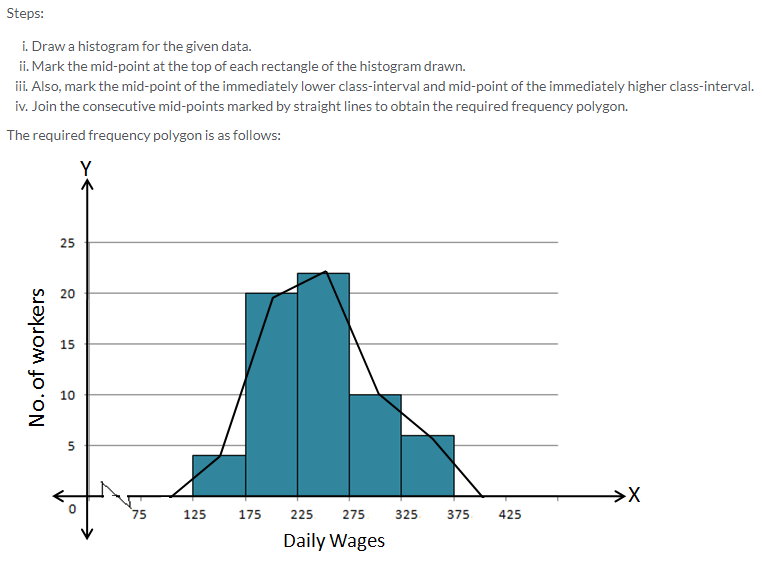
Question 20. The daily wages of 160 workers in a building project are given below:
Question 21. The marks obtained by 120 students in a test are given below:
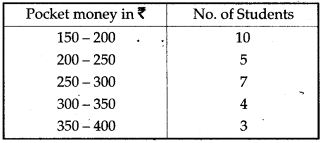
Question 22. (Use a graph paper for this question.) The daily pocket expenses of 200 students in a school are given below:
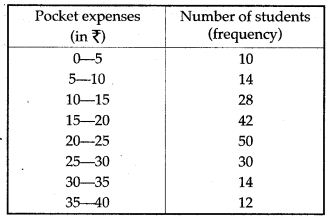
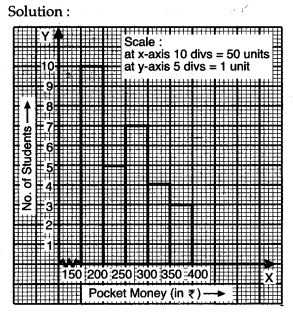
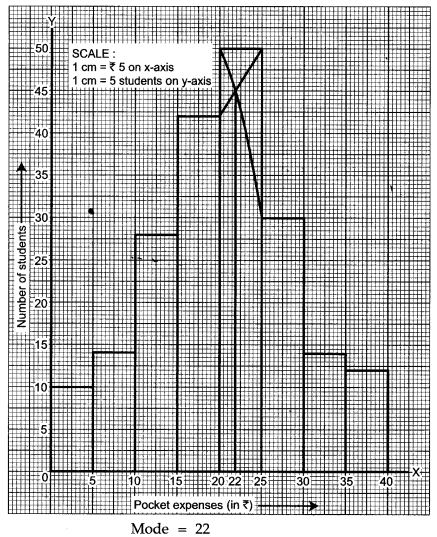
Draw a histogram representing the above distribution and estimate the mode from the graph.
Solution: Histogram on the graph paper.
Question 23. The marks obtained by 100 students in a Mathematics test are given below:
Concept Based Questions
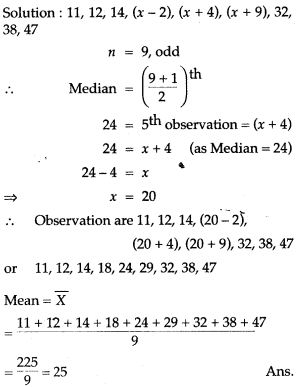
Question 1. The median of the following observations 11, 12, 14, (x – 2), (x + 4), (x + 9), 32, 38, 47 arranged in ascending order is 24. Find the value of x and hence find the mean.
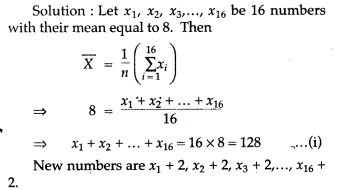
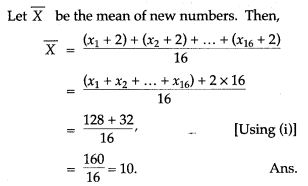
Question 2. The mean of 16 numbers is 8. If 2 is added to every number, what will be the new mean ?
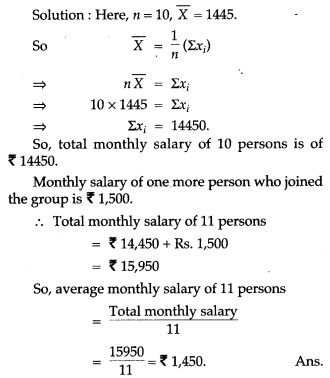
Question 3. The mean monthly salary of 10 members of a group is Rs.1,445, one more member whose monthly salary is Rs.1,500 has joined the group. Find the mean monthly salary of 11 members of the group.
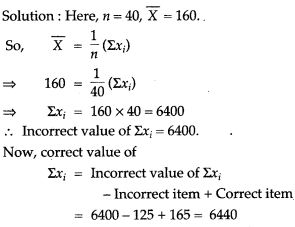
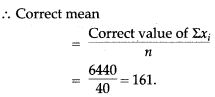
Question 4. The mean of 40 observations was 160. It was detected on rechecking that the value of 165 was wrongly copied as 125 for computation of mean. Find the correct mean.
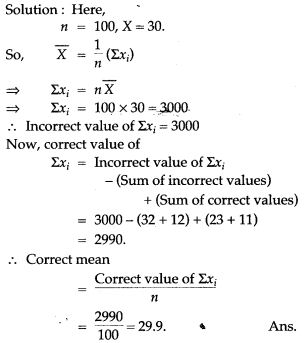
Question 5. The mean of 100 items was found to be 30. If at the time of calculation two items were wrongly taken as 32 and 12 instead of 23 and 11, find the correct mean.
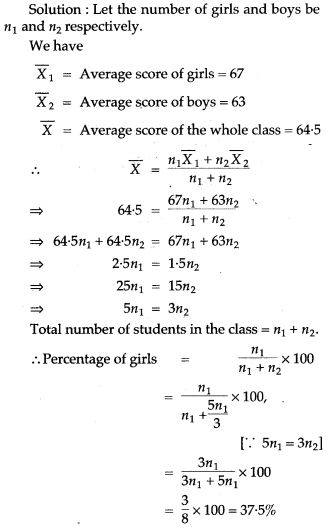
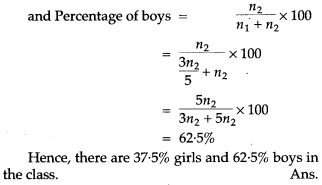
Question 7. The average score of girls in class X examination in school is 67 and that of boys is 63. The average score for the whole class is 64.5. Find the percentage of girls and boys in the class.
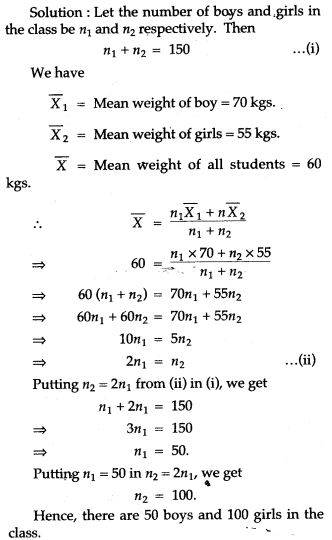
Question 8. The mean weight of 150 students in a certain class is 60 kgs. The mean weight of boys in the class is 70 kg and that of girls is 55 kgs. Find the number of boys and the number of girls in the class.
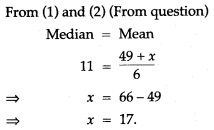
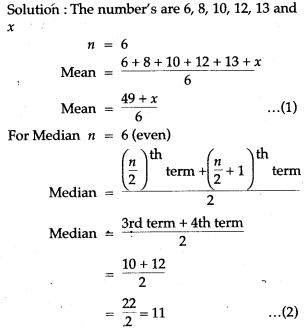
Question 9. The numbers 6, 8, 10, 12, 13, and x are arranged in an ascending order. If the mean of the observations is equal to the median, find the value of x.
For More Resources
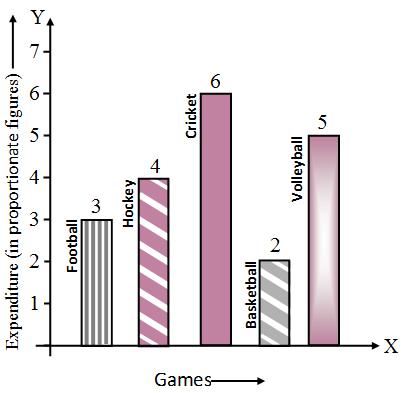 Solution: Proportionate amount spent on Football, Hockey, Cricket, Basketball, and volleyball are in the ratio 3 : 4 : 6 : 2 : 5 respectively. Total amount spent = RS. 2,00,000.