What is Cumulative Frequency Curve or the Ogive in Statistics

What is Cumulative Frequency Curve or the Ogive in Statistics

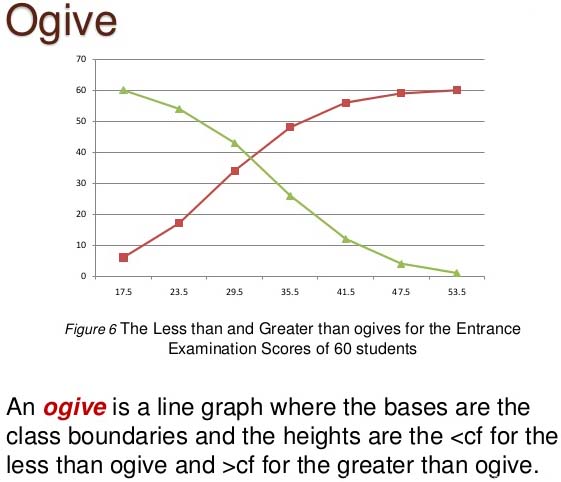
First we prepare the cumulative frequency table, then the cumulative frequencies are plotted against the upper or lower limits of the corresponding class intervals. By joining the points the curve so obtained is called a cumulative frequency curve or ogive.
There are two types of ogives :

  1. Less than ogive : Plot the points with the upper limits of the class as abscissae and the corresponding less than cumulative frequencies as ordinates. The points are joined by free hand smooth curve to give less than cumulative frequency curve or the less than Ogive. It is a rising curve.
  2. Greater than ogive : Plot the points with the lower limits of the classes as abscissa and the corresponding Greater than cumulative frequencies as ordinates. Join the points by a free hand smooth curve to get the “More than Ogive”. It is a falling curve.

When the points obtained are joined by straight lines, the picture obtained is called cumulative frequency polygon.
Less than ogive method:
To construct a cumulative frequency polygon and an ogive by less than method, we use the following algorithm.
Algorithm
Step 1 :     Start with the upper limits of class intervals and add class frequencies to obtain the cumulative frequency distribution.
Step 2 :     Mark upper class limits along X-axis on a suitable scale.
Step 3 :     Mark cumulative frequencies along Y-axis on a suitable scale.
Step 4 :     Plot the points (xi, fi) where xi is the upper limit of a class and fi is corresponding cumulative frequency.
Step 5 :     Join the points obtained in step 4 by a free hand smooth curve to get the ogive and to get the cumulative frequency polygon join the points obtained in step 4 by line segments.

More than ogive method:
To construct a cumulative frequency polygon and an ogive by more than method, we use the following algorithm.
Algorithm
Step 1 :     Start with the lower limits of the class intervals and from the total frequencysubtract the frequency of each class to obtain the cumulative frequency distribution.
Step 2 :     Mark the lower class limits along X-axis on a sutiable scale.
Step 3 :     Mark the cumulative frequencies along Y-axis on a suitable scale.
Step 4 :     Plot the points (xi, fi) where xi is the lower limit of a class and fi is corresponding cumulative frequency.
Step 5 :     Join the points obtained in step 4 by a free hand smooth curve to get the ogive and to get the cumulative frequency polygon join these points by line segments

Read  More:

Cumulative Frequency Curve or the Ogive Example Problems with Solutions

Example 1:    Draw a less than ogive for the following frequency distribution :

I.Q.Frequency
60 – 702
70 – 805
80 –9012
90 – 10031
100 – 11039
110 – 12010
120 – 1304

Find the median from the curve.
Solution:     Let us prepare following table showing the cumulative frequencies more than the upper limit.

Class interval (I. Q)Frequency (f)Cumulative frequency
60 – 7022
70 – 8052 + 5 = 7
80 –90122 + 5 + 12 = 19
90 – 100312 + 5 + 12 + 31 = 50
100 – 110392 + 5 + 12 + 31 + 39 = 89
110 – 120102 + 5 + 12 + 31 + 39 + 10 = 99
120 – 13042 + 5 + 12 + 31 + 39 + 10 + 4 = 103

Less than ogive :
I.Q. is taken on the x-axis. Number of students are marked on y-axis.
Points (70, 2), (80, 7), (90, 19), (100, 50), (110, 89), (120, 99), (130, 103), are plotted on graph paper and these points are joined by free hand. The curve obtained is less than ogive.
What is Cumulative Frequency Curve or the Ogive in Statistics 1
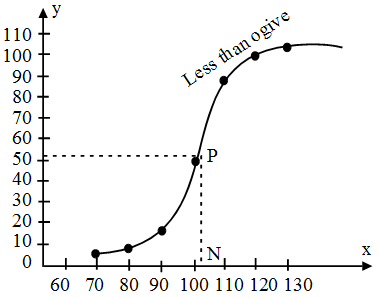
The value \(\frac{N}{2}\) = 51.5 is marked on y-axis and from  this point a line parallel to x-axis is drawn. This line meets the curve at a point P. From P draw a perpendicular PN to meet x-axis at N. N represents the median.
Here median is 100.5.
Hence, the median of given frequency distribution is 100.5

Example 2:    The following table shows the daily sales of 230 footpath sellers of Chandni Chowk.

Sales in Rs.No. of sellers
0 – 50012
500 – 100018
1000 – 150035
1500 – 200042
2000 – 250050
2500 – 300045
3000 – 350020
3500 – 40008

Locate the median of the above data using only the less than type ogive.
Solution:     To draw ogive, we need to have a cumulative frequency distribution.

Sales in Rs.No. of sellersLess than type cumulative frequency
0 – 5001212
500 – 10001830
1000 – 15003565
1500 – 200042107
2000 – 250050157
2500 – 300045202
3000 – 350020222
3500 – 40008230

Less than ogive :
Seles in Rs. are taken on the y-axis and number of sellers are taken on x-axis. For drawing less than ogive, points (500, 12), (1000, 30), (1500, 65), (2000, 107), (2500, 157), (3000, 202), (3500, 222), (4000, 230) are plotted on graph paper and these are joined free hand to obtain the less than ogive.
What is Cumulative Frequency Curve or the Ogive in Statistics 2
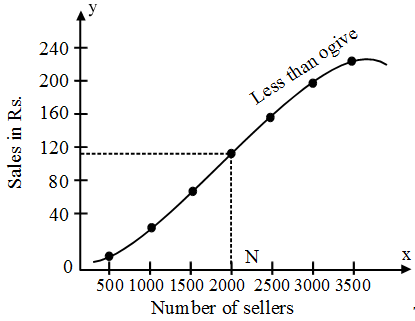
The value \(\frac{N}{2}\) = 115 is marked on y-axis and a line parallel to x-axis is drawn. This line meets the curve at a point P. From P draw a perpendicular PN to meet x-axis at median. Median = 2000.
Hence, the median of given frequency distribution is 2000.

Example 3:    Draw the two ogives for the following frequency distribution of the weekly wages of (less than and more than) number of workers.

Weekly wagesNumber of workers
0 – 2041
20 – 4051
40 – 6064
60 – 8038
80 – 1007

Hence find the value of median.
Solution:     

Weekly wagesNumber of workersC.F (less than)C.F (More than)
0 – 204141201
20 – 405192160
40 – 6064156109
60 – 803819445
80 – 10072017

Less than curve :  
Upper limits of class intervals are marked on the x-axis and less than type cumulative frequencies are taken on y-axis. For drawing less than type curve, points (20, 41), (40, 92), (60, 156), (80, 194), (100, 201) are plotted on the graph paper and these are joined by free hand to obtain the less than ogive.
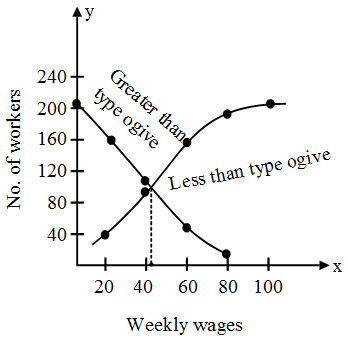
What is Cumulative Frequency Curve or the Ogive in Statistics 3
Greater than ogive
Lower limits of class interval are marked on x-axis and greater than type cumulative frequencies are taken on y-axis. For drawing greater than type curve, points (0, 201), (20, 160), (40, 109), (60, 45) and (80, 7) are plotted on the graph paper and these are joined by free hand to obtain the greater than type ogive. From the point of intersection of these curves a perpendicular line on x-axis is drawn. The point at which this line meets x-axis determines the median. Here the median is 42.652.

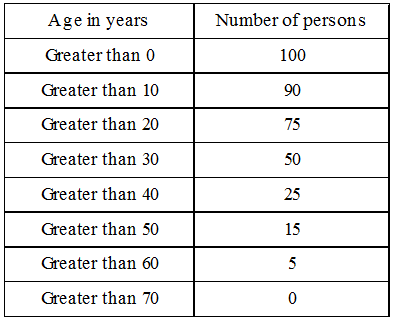
Example 4:    Following table gives the cumulative frequency of the age of a group of 199 teachers.
Draw the less than ogive and greater than ogive and find the median.

Age in yearsCum. Frequency
20 – 2521
25 – 3040
30 – 3590
35 – 40130
40 – 45146
45 – 50166
50 – 55176
55 – 60186
60 – 65195
65 – 70199

Solution:     

Age in yearsLess than cumulative frequencyFrequencyGreater than type
20 – 252121199
25 – 304019178
30 – 359050159
35 – 4013040109
40 – 451461669
45 – 501662053
50 – 551761033
55 – 601861023
60 – 65195913
65 – 7019944

Find out the frequencies by subtracting previous  frequency from the next frequency to get simple frequency. Now we can prepare the greater than type frequency. Ages are taken on x-axis and number of teachers on y-axis.
Less than ogive :
Plot the points (25, 21), (30, 40), (35, 90), (40, 130), (45, 146), (50, 166), (55, 176), (60, 186), (65, 195), (70, 199) on graph paper. Join these points free hand to get less than ogive.
Greater than ogive :
Plot the points (20, 199), (25, 178), (30, 159), (35, 109), (40, 69), (45, 53), (50, 33), (55, 23), (60, 13), (65, 4) on graph paper. Join these points freehand to get greater than ogive. Median is the point of intersection of these two curves.
What is Cumulative Frequency Curve or the Ogive in Statistics 4
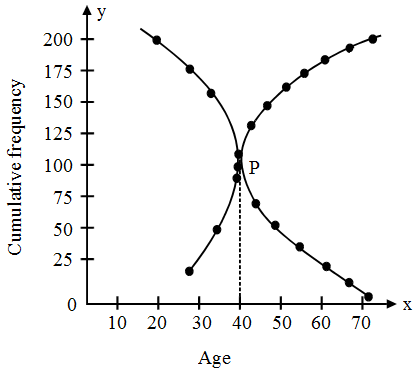
Here median is 37.375.

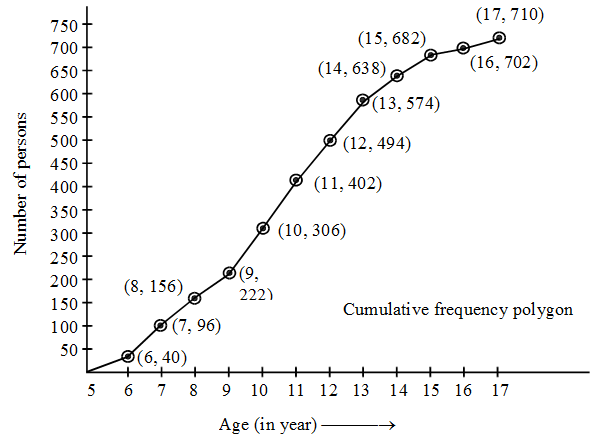
Example 5:    Following is the age distribution of a group of students. Draw the cumulative frequency polygon, cumulative frequency curve (less than type) and hence obtain the median value.

AgeFrequency
5 – 640
6 – 756
7 – 860
8 – 966
9 – 1084
10 – 1196
11 – 1292
12 – 1380
13 – 1464
14 – 1544
15 – 1620
16 – 178

Solution:     We first prepare the cumulative frequency table by less then method as given below :

AgeFrequencyAge less thanCumulative frequency
5 – 640640
6 – 756796
7 – 8608156
8 – 9669222
9 – 108410306
10 – 119611402
11 – 129212494
12 – 138013574
13 – 146414638
14 – 154415682
15 – 162016702
16 – 17817710

Other than the given class intervals, we assume a class 4-5 before the first class interval 5-6 with zero frequency.
Now, we mark the upper class limits (including the imagined class) along X-axis on a suitable scale and the cumulative frequencies along Y-axis on a suitable scale.
Thus, we plot the points (5, 0), (6, 40), (7, 96),  (8, 156), (9, 222), (10, 306), (11, 402), (12, 494), (13, 574), (14, 638), (15, 682), (16, 702) and (17, 710).
These points are marked and joined by line segments to obtain the cumulative frequency polygon shown in Fig.
What is Cumulative Frequency Curve or the Ogive in Statistics 5
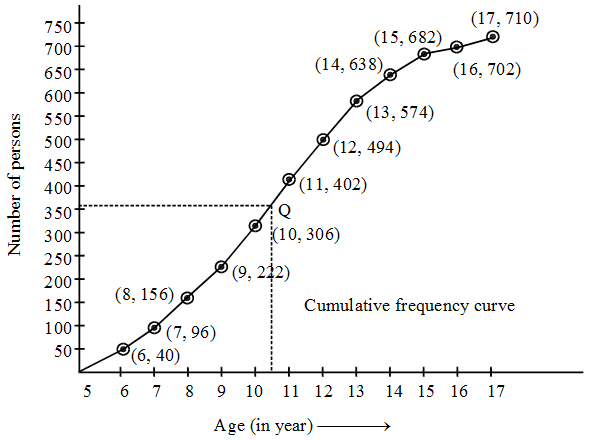
In order to obtain the cumulative frequency curve, we draw a smooth curve passing through the points discussed above. The graph (fig) shows the total number of students as 710. The median is the age corresponding to \(\frac{N}{2}\,\, = \,\,\frac{{710}}{2}\) = 355 students. In order to find the median, we first located the point corresponding to 355th student on Y-axis. Let the point be P. From this point draw a line parallel to the X-axis cutting the curve at Q. From this point Q draw a line parallel to Y-axis and meeting X-axis at the point M. The x-coordinate of M is 10.5 (See Fig.). Hence, median is 10.5.
What is Cumulative Frequency Curve or the Ogive in Statistics 6

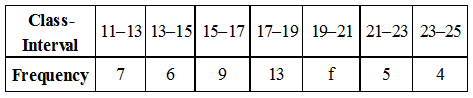
Example 6:    The following observations relate to the height of a group of persons. Draw the two type of cumulative frequency polygons and cumulative frequency curves and determine the median.

Height in cms140–143143–146146–149149–152152–155155–158158–161
Frequency392631456478
Height in cms161–164164–167167–170170–173173–176176–179179–182
Frequency8596726043206

Solution:     Less than method :  We first prepare the cumulative frequency table by less than method as given below :

Height in cmsFrequencyHeight less thanFrequency
140–14331433
143–146914612
146–1492614938
149–1523115269
152–15545155114
155–15864158178
158–16178161256
161–16485164341
164–16796167437
167–17072170509
170–17360173569
173–17643176612
176–17920179632
179–1826182638

Other than the given class intervals, we assume a class interval 137-140 prior to the first class interval 140-143 with zero frequency.
Now, we mark the upper class limits on X-axis and cumulative frequency along Y-axis on a suitable scale.
We plot the points (140, 0), (143, 3), (146, 12),  (149, 38), (152, 69), (155, 114), (158, 178), (161, 256),
(164, 341), (167, 437), (170, 509), (173, 569), (176, 612),.(179, 632) and 182, 638).
What is Cumulative Frequency Curve or the Ogive in Statistics 7
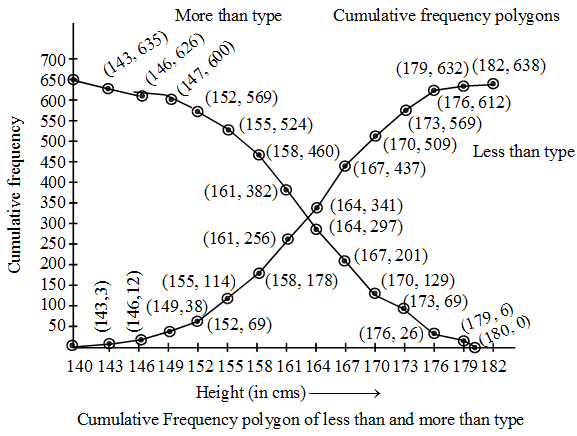
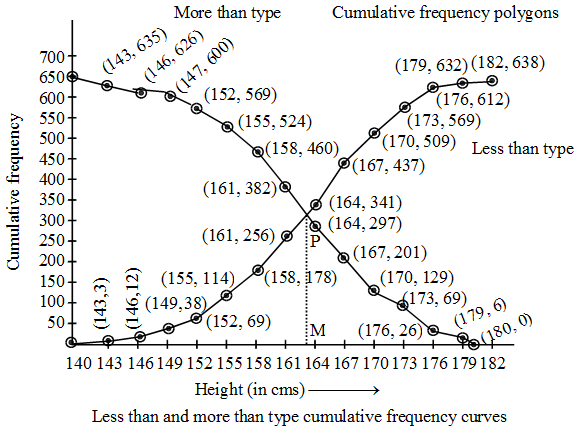
These points are joined by line segments to obtain the cumulative frequency polygon as shown in fig. and by a free hand smooth curve to obtain an ogive by less than method as shown in fig.
What is Cumulative Frequency Curve or the Ogive in Statistics 8
More than method : We prepare the cumulative frequency table by more than method as given below :
Other than the given class intervals, we assume the class interval 182-185 with zero frequency.
Now, we mark the lower class limits on X-axis and the cumulative frequencies along Y-axis on suitable scales to plot the points (140, 638), (143, 635), (146, 626),  (149, 600), (152, 569), (155, 524), (158, 460), (161, 382),  (164, 297), (167, 201), (170, 129), (173, 69), (176, 26) and (179, 6). By joining these points by line segments, we obtain the more than type frequency polygon as shown in fig. By joining these points by a free hand curve, we obtain more than type cumulative frequency curve as points by a free hand curve, we obtain more than type cumulative frequency curves as shown in fig.
We find that the two types of cumulative frequency curves intersect at point P. From point P perpendicular PM is drawn on X-axis. The value of height corresponding to M is 163.2 cm. Hence, median is 163.2 cm.

What is a Grouped Frequency Distribution Table

What is a Grouped Frequency Distribution Table

There are 3 methods for calculation of mean :

  1. Direct Method
  2. Assumed mean deviation method
  3. Step deviation method.

1. Direct Method for Calculation of Mean
What is a Grouped Frequency Distribution Table 1
According to direct method
What is a Grouped Frequency Distribution Table 2

2. Assumed Mean Method
Arithmetic mean = \(a + \frac{{\sum\limits_{i = 1}^n {{f_i}{d_i}} }}{{\sum\limits_{i = 1}^n {{f_i}} }}\)
Note : The assumed mean is chosen, in such a manner, that

  1. It should be one of the central values.
  2. The deviation are small.
  3. One deviation is zero.

Working Rule :
Step 1 :       Choose a number ‘a’ from the central values of x of the first column, that will be our assumed mean.
Step 2 :      Obtain deviations di by subtracting ‘a’ from xi. Write down hese deviations against the corresponding frequencies in the third column.
Step 3 :      Multiply the frequencies of second column with corresponding deviations di in the third column to prepare a fourth column of fidi.
Step 4 :      Find the sum of all the entries of fourth column to obtain ∑fidi and also, find the sum of all the frequencies in the second column to obtain ∑fi.

Read More:

3. Step Deviation Method
Deviation method can be further simplified on dividing the deviation by width of the class interval h. In such a case the arithmetic mean is reduced to a great extent.
Mean (\(\bar x\)) = a + \(\frac{{\Sigma {f_i}{u_i}}}{{\Sigma {f_i}}} \times h\)
Working Rule :
Step-1 :     Choose a number ‘a’ from the central values of x(mid-values)
Step-2 :    Obtain ui = \(\frac{{{x_i} – a}}{h}\)
Step-3 :    Multiply the frequency fi with the corresponding ui to get fiui.
Step-4 :    Find the sum of all fiui.e., ∑fiui
Step-5 :     Use the formula  = a + \(\frac{{\Sigma {f_i}{u_i}}}{{\Sigma {f_i}}} \times h\) to get the required mean.

Grouped Frequency Distribution Table Example Problems with Solutions

Example 1:    

Mid-values23456
Frequencies4943573813

Find the mean by direct method.

Solution:

Mid Values  frequencies (fi)fixi
24998
343129
457228
538190
61378
TotalN = Σfi = 50Σfixi = 2750

Mean = \(\frac{{\sum {f_i}{x_i}}}{{\sum {f_i}}}\) = \(\frac{{723}}{{200}}\) = 3.615

Example 2:    Find the mean of the following frequency distribution :

Class IntervalFrequency
10-3090
30-5020
50-7030
70-9020
90-11040

Solution:

Class IntervalfMid value (x)f × x
10-3090201800
30-502040800
50-7030601800
70-9020801600
90-110401004000
Σf = 200Σfx = 10000

Mean = \(\frac{{\sum {f}{x}}}{{\sum {f}}}\) = \(\frac{{10000}}{{200}}\) = 50

Example 3:    A survey was conducted by a group of students as a part of their environment awareness programme, in which they collected the following data regarding the number of plants in 20 houses in a locality. Find  the mean number of plants per house.

Number of plants0 – 22 – 44 – 66 – 88 – 1010 – 1212 – 14
No. of houses1215623

Which method did you use for finding the mean and why ?
Solution:

Number of plantsNumber of houses (f)Mid value (x)f × x
0-2111
2-4236
4-6155
6-85735
8-106954
10-1221122
12-1431339
Σf = 20Σfx = 162

Mean = \(\frac{{\sum {f}{x}}}{{\sum {f}}}\) = \(\frac{{162}}{{20}}\) = 8.1

Example 4:    Calculate the mean for the following distribution:

Variable56789
Frequency4814113

Solution:
What is a Grouped Frequency Distribution Table 3
∴ Mean = \(\frac{{\sum f\,x}}{{\sum f}} = \frac{{281}}{{40}}\)  = 7.025

Example 5:    Find the mean of the following frequency distribution :
What is a Grouped Frequency Distribution Table 4
Solution:
What is a Grouped Frequency Distribution Table 5
Mean = \(\frac{{\sum f\,x}}{{\sum f}} = \frac{{4930}}{{150}} = 32.8\overline 6\) or 32.87 (approx.)

Example 6:    Find the mean of the following distribution by direct method.

Class interval0 – 1011 – 2021 – 3031 – 4041 – 50
Frequency34256

Solution:
What is a Grouped Frequency Distribution Table 6
Mean = \(\frac{{\sum f\,x}}{{\sum f}} = \frac{{578.5}}{{20}}\) = 28.9

Example 7:    For the following distribution, calculate mean using all the suitable methods.

Size of Item1 – 44 – 99 – 1616 – 27
Frequency6122620

Solution:
What is a Grouped Frequency Distribution Table 7
Mean = \(\frac{{\sum f\,x}}{{\sum f}} = \frac{{848}}{{64}}\)  = 13.25

Example 8:    The following table gives the distribution of total household expenditure (in rupees) of manual workers in a city.

Expenditure (in rupees) 100-150150-200200-250250-300300-350350-400400-450450-500
Frequency244033283022167

Solution:    Let assumed mean = 275
What is a Grouped Frequency Distribution Table 8
\(\bar x = a + \frac{{\Sigma {f_i}{d_i}}}{{\Sigma {f_i}}}\) = 275 + \(\frac{{ – 1750}}{{200}}\) = Rs 266.25

Example 9:    Calculate the arithmetic mean of the following distribution :

Class IntervalFrequency
0 – 5017
50 –10035
100 –15043
150–20040
200– 25021
250– 30024

Solution:    Let assumed mean = 175 i.e. a = 175
What is a Grouped Frequency Distribution Table 9
Now , a = 175
\(\bar x = a + \frac{{\Sigma {f_i}{d_i}}}{{\Sigma {f_i}}}\) = 175 + \(\frac{{ – 4750}}{{180}}\)
= 175 – 26.39 = 148.61 approx.

Example 10:    Calculate the arithmetic mean of the following frequency distribution :

Class interval 50– 6060–7070–8080–9090– 100
Frequency86121113

Solution:    Let assumed mean = 75 i.e., a = 75
What is a Grouped Frequency Distribution Table 10
a = 75, Σfidi= 150, Σfi = 50
Mean \(\bar x = a + \frac{{\Sigma {f_i}{d_i}}}{{\Sigma {f_i}}}\) = 75 + \(\frac{{ 150}}{{50}}\) = 78

Example 11:    Thirty women were examined in a hospital by a doctor and the number of heart beats per minute were recorded and summarised as follows. Find the mean heart beats per minute for these women, choosing a suitable method.

Number of heart beats per minuteFrequency
65– 682
68–714
71–743
74–778
77– 807
80– 834
83– 862

Solution:    Let assumed mean a  = 75.5
What is a Grouped Frequency Distribution Table 11
Mean = \(a + \frac{{\Sigma fd}}{{\Sigma f}} = 75.5 + \frac{{12}}{{30}}\) = 75.5 + 0.4 = 75.9

Example 12:    To find out the concentration of SO2 in the air (in parts per million, i.e.ppm), the data was collected for 30 localities in a certain city and is presented below :
What is a Grouped Frequency Distribution Table 12
Find the mean concentration of SO2 in the air.
Solution:    Let the assumed mean a = 0.10.
What is a Grouped Frequency Distribution Table 13
By step deviation method
Mean = a + \(\frac{{\Sigma {f_i}{u_i}}}{{\Sigma {f_i}}}\) × h
= 0.10 + \(\frac{{–1}}{{30}} \times 0.04\)
= 0.10 – 0.0013
= 0.0987
= 0.099 ppm

Example 13:    The weekly observation on cost of living index in a certain city for the year 2004–2005 are given below. Compute the mean weekly cost of living index.
What is a Grouped Frequency Distribution Table 14
Solution:    Let assumed mean be 1750 i.e., a = 1750
What is a Grouped Frequency Distribution Table 15
By step deviation method
Mean (\(\bar x\)) = a + \(\frac{{\Sigma {f_i}{u_i}}}{{\Sigma {f_i}}}\) × h
= 1750 + \(\frac{{ – 45}}{{52}} \times 100\)
= 1750 – 86.54
= 1663.46
Hence, the mean weekly cost of living index
= 1663.46

Example 14:    Find the mean marks from the following data by step deviation method
What is a Grouped Frequency Distribution Table 16
Solution:    Let assumed mean = 55 ⇒ a = 55
What is a Grouped Frequency Distribution Table 17
Here, a = 55, h = 10,
Σfi = 85,  Σfiui = –56
Mean (\(\bar x\)) = a + \(\frac{{\Sigma {f_i}{u_i}}}{{\Sigma {f_i}}}\) × h
h = 55 + \(\frac{{ – 56}}{{85}} \times 10\)
= 55 – 6.59 = 48.41
Hence, mean mark = 48.41.

Example 15:    Find the mean age of 100 residents of a colony from the follwing data :
What is a Grouped Frequency Distribution Table 18
Solution:    Let assumed mean a = 35
What is a Grouped Frequency Distribution Table 19
Here, a = 35,  h = 10
\(\bar x\) = a + \(\frac{{\Sigma {f_i}{u_i}}}{{\Sigma {f_i}}}\) × h
⇒  \(\bar x\)  = 35 + \(\frac{{ – 40}}{{100}} \times 10\) = 31
Hence, the mean age = 31 years

Example 16:    The following distribution show the daily pocket allowance of children of a locality. The mean pocket allowance is Rs. 18.00. Find the missing frequency f.
What is a Grouped Frequency Distribution Table 20
Solution:    we have,
What is a Grouped Frequency Distribution Table 21
Mean  \(\bar x\) = \(\frac{{\Sigma fx}}{{\Sigma f}}\)  ⇒   18 = \(\frac{{752 + 20f}}{{44 + f}}\)
⇒   18 (44 + f) = 752 + 20f
⇒   752 + 20f = 792 + 18f
⇒   2f = 40
⇒      f = 20
Hence, the missing frequency is 20.

Example 17:    The arithmetic mean of the following frequency distribution is 50. Find the value of p.
What is a Grouped Frequency Distribution Table 22
Solution:    
What is a Grouped Frequency Distribution Table 23
Mean \(\bar x\) = \(\frac{{\Sigma fx}}{{\Sigma f}}\)  ⇒  50 = \(\frac{{5160 + 30P}}{{92 + P}}\)
⇒   50 (92 + P) = 5160 + 30 P
⇒   4600 + 50 P = 5160 + 30P
⇒   20 P = 560
⇒   P = 28

Example 18:    The mean of the following frequency distribution  is 62.8 and the sum of all frequencies is 50. Compute the missing frequencies f1 and f2 :
What is a Grouped Frequency Distribution Table 24
Solution:    
What is a Grouped Frequency Distribution Table 25
30 + f1 + f2 = 50 ⇒ f1 + f2 = 20    ….(1)
Mean  = \(\frac{{\Sigma fx}}{{\Sigma f}}\) ⇒  62.8 = \(\frac{{2060 + 30{f_1} + 70{f_2}}}{{50}}\)
⇒  62.8 = \(\frac{{206 + 3{f_1} + 7{f_2}}}{5}\)
⇒  206 + 3f1 + 7f2 = 314
⇒   3f1 + 7f2 = 108                     ….(2)
3f1 + 3f2 = 60                            ….(3)
[Multiplying (1) by 3]
On Subtracting (3) from (2), we get
4f2 = 48  ⇒  f2 = 12
Putting f2 = 12 in (1), we get
f1 = 8

Glencoe Algebra 1 Solutions Chapter 13 Statistics Exercise 13.5

Glencoe Algebra 1 Solutions Chapter 13 Statistics Exercise 13.5


Glencoe Algebra 1 Chapters Answer Key

Glencoe Algebra 1 Solutions Chapter 13 Statistics Exercise 13.5

Answer 1AA.
Glencoe-Algebra-1-answers-Statistics-13.5-1aa
Glencoe-Algebra-1-answers-Statistics-13.5-1aa-1
Answer 1CU.
Glencoe-Algebra-1-answers-Statistics-13.5-1cu
Answer 2CU.
Glencoe-Algebra-1-answers-Statistics-13.5-2aa
Answer 2CU.
Glencoe-Algebra-1-answers-Statistics-13.5-2cu
Answer 3AA.
Glencoe-Algebra-1-answers-Statistics-13.5-3aa
Answer 3CU.
Glencoe-Algebra-1-answers-Statistics-13.5-3cu
Answer 4AA.
Glencoe-Algebra-1-answers-Statistics-13.5-4aa
Answer 4CU.
Glencoe-Algebra-1-answers-Statistics-13.5-4cu
Glencoe-Algebra-1-answers-Statistics-13.5-4cu-1
Answer 5CU.
Glencoe-Algebra-1-answers-Statistics-13.5-5cu
Glencoe-Algebra-1-answers-Statistics-13.5-5cu-1
Answer 6CU.
Glencoe-Algebra-1-answers-Statistics-13.5-6cu
Glencoe-Algebra-1-answers-Statistics-13.5-6cu-1
Answer 7CU.
Glencoe-Algebra-1-answers-Statistics-13.5-7cu
Glencoe-Algebra-1-answers-Statistics-13.5-7cu-1
Answer 8AA.
Glencoe-Algebra-1-answers-Statistics-13.5-8aa
Answer 8CU.
Glencoe-Algebra-1-answers-Statistics-13.5-8cu
Glencoe-Algebra-1-answers-Statistics-13.5-8cu-1
Answer 9AA.
Glencoe-Algebra-1-answers-Statistics-13.5-9aa
Glencoe-Algebra-1-answers-Statistics-13.5-9aa-1
Answer 9CU.
Glencoe-Algebra-1-answers-Statistics-13.5-9cu
Glencoe-Algebra-1-answers-Statistics-13.5-9cu-1
Answer 10AA.
Glencoe-Algebra-1-answers-Statistics-13.5-10aa
Glencoe-Algebra-1-answers-Statistics-13.5-10aa-1
Answer 10PA.
Glencoe-Algebra-1-answers-Statistics-13.5-10pa
Answer 11PA.
Glencoe-Algebra-1-answers-Statistics-13.5-11pa
Answer 12PA.
Glencoe-Algebra-1-answers-Statistics-13.5-12pa
Answer 13PA.
Glencoe-Algebra-1-answers-Statistics-13.5-13pa
Answer 14PA.
Glencoe-Algebra-1-answers-Statistics-13.5-14pa
Glencoe-Algebra-1-answers-Statistics-13.5-14pa-1
Answer 15PA.
Glencoe-Algebra-1-answers-Statistics-13.5-15pa
Glencoe-Algebra-1-answers-Statistics-13.5-15pa-1
Answer 16PA.
Glencoe-Algebra-1-answers-Statistics-13.5-16pa
Glencoe-Algebra-1-answers-Statistics-13.5-16pa-1
Answer 17PA.
Glencoe-Algebra-1-answers-Statistics-13.5-17pa
Glencoe-Algebra-1-answers-Statistics-13.5-17pa-1
Answer 18PA.
Glencoe-Algebra-1-answers-Statistics-13.5-18pa
Glencoe-Algebra-1-answers-Statistics-13.5-18pa-1
Answer 19PA.
Glencoe-Algebra-1-answers-Statistics-13.5-19pa
Glencoe-Algebra-1-answers-Statistics-13.5-19pa-1
Answer 20PA.
Glencoe-Algebra-1-answers-Statistics-13.5-20pa
Answer 21PA.
Glencoe-Algebra-1-answers-Statistics-13.5-21pa
Answer 22PA.
Glencoe-Algebra-1-answers-Statistics-13.5-22pa
Answer 23PA.
Glencoe-Algebra-1-answers-Statistics-13.5-23pa
Answer 24PA.
Glencoe-Algebra-1-answers-Statistics-13.5-24pa
Glencoe-Algebra-1-answers-Statistics-13.5-24pa-1
Answer 25PA.
Glencoe-Algebra-1-answers-Statistics-13.5-25pa
Answer 26PA.
Glencoe-Algebra-1-answers-Statistics-13.5-26pa
Glencoe-Algebra-1-answers-Statistics-13.5-26pa-1
Answer 27PA.
Glencoe-Algebra-1-answers-Statistics-13.5-27pa
Glencoe-Algebra-1-answers-Statistics-13.5-27pa-1
Answer 28PA.
Glencoe-Algebra-1-answers-Statistics-13.5-28pa
Glencoe-Algebra-1-answers-Statistics-13.5-28pa-1
Answer 29PA.
Glencoe-Algebra-1-answers-Statistics-13.5-29pa
Glencoe-Algebra-1-answers-Statistics-13.5-29pa-1
Answer 30PA.
Glencoe-Algebra-1-answers-Statistics-13.5-30pa
Glencoe-Algebra-1-answers-Statistics-13.5-30pa-1
Answer 31PA.
Glencoe-Algebra-1-answers-Statistics-13.5-31pa
Glencoe-Algebra-1-answers-Statistics-13.5-31pa-1
Answer 32PA.
Glencoe-Algebra-1-answers-Statistics-13.5-32pa
Answer 33PA.
Glencoe-Algebra-1-answers-Statistics-13.5-33pa
Answer 34PA.
Glencoe-Algebra-1-answers-Statistics-13.5-34pa
Answer 35PA.
Glencoe-Algebra-1-answers-Statistics-13.5-35pa
Answer 36PA.
Glencoe-Algebra-1-answers-Statistics-13.5-36pa
Glencoe-Algebra-1-answers-Statistics-13.5-36pa-1
Answer 37PA.
Glencoe-Algebra-1-answers-Statistics-13.5-37pa
Glencoe-Algebra-1-answers-Statistics-13.5-37pa-1
Glencoe-Algebra-1-answers-Statistics-13.5-37pa-2
Answer 38PA.
Glencoe-Algebra-1-answers-Statistics-13.5-38pa
Answer 39PA.
Glencoe-Algebra-1-answers-Statistics-13.5-39pa
Answer 40PA.
Glencoe-Algebra-1-answers-Statistics-13.5-40pa
Glencoe-Algebra-1-answers-Statistics-13.5-40pa-1
Answer 41PA.
Glencoe-Algebra-1-answers-Statistics-13.5-41pa
Answer 42PA.
Glencoe-Algebra-1-answers-Statistics-13.5-42pa
Answer 43MYS.
Glencoe-Algebra-1-answers-Statistics-13.5-43mys
Answer 44MYS.
Glencoe-Algebra-1-answers-Statistics-13.5-44mys
Glencoe-Algebra-1-answers-Statistics-13.5-44mys-1
Answer 45MYS.
Glencoe-Algebra-1-answers-Statistics-13.5-45mys
Answer 46MYS.
Glencoe-Algebra-1-answers-Statistics-13.5-46mys
Answer 47MYS.
Glencoe-Algebra-1-answers-Statistics-13.5-47mys
Answer 48MYS.
Glencoe-Algebra-1-answers-Statistics-13.5-48mys
Answer 49MYS.
Glencoe-Algebra-1-answers-Statistics-13.5-49mys
Answer 50MYS.
Glencoe-Algebra-1-answers-Statistics-13.5-50mys
Answer 51MYS.
Glencoe-Algebra-1-answers-Statistics-13.5-51mys
Answer 52MYS.
Glencoe-Algebra-1-answers-Statistics-13.5-52mys
Answer 53MYS.
Glencoe-Algebra-1-answers-Statistics-13.5-53mys
Answer 54MYS.
Glencoe-Algebra-1-answers-Statistics-13.5-54mys
Answer 55MYS.
Glencoe-Algebra-1-answers-Statistics-13.5-55mys
Answer 56MYS.
Glencoe-Algebra-1-answers-Statistics-13.5-56mys
Answer 57MYS.
Glencoe-Algebra-1-answers-Statistics-13.5-57mys

Glencoe Algebra 1 Solutions Chapter 13 Statistics Exercise 13.4

Glencoe Algebra 1 Solutions Chapter 13 Statistics Exercise 13.4


Glencoe Algebra 1 Chapters Answer Key

Glencoe Algebra 1 Solutions Chapter 13 Statistics Exercise 13.4

Answer 1CU.
Glencoe-Algebra-1-answers-Statistics-13.4-1cu
Glencoe-Algebra-1-answers-Statistics-13.4-1cu-1
Answer 1PQ.
Glencoe-Algebra-1-answers-Statistics-13.4-1pq
Answer 2CU.
Glencoe-Algebra-1-answers-Statistics-13.4-2cu
Answer 2PQ.
Glencoe-Algebra-1-answers-Statistics-13.4-2pq
Answer 3CU.
Glencoe-Algebra-1-answers-Statistics-13.4-3cu
Answer 3PQ.
Glencoe-Algebra-1-answers-Statistics-13.4-3pq
Glencoe-Algebra-1-answers-Statistics-13.4-3pq-1
Answer 4CU.
Glencoe-Algebra-1-answers-Statistics-13.4-4cu
Glencoe-Algebra-1-answers-Statistics-13.4-4cu-1
Answer 4PQ.
Glencoe-Algebra-1-answers-Statistics-13.4-4pq
Glencoe-Algebra-1-answers-Statistics-13.4-4pq-1
Answer 5CU.
Glencoe-Algebra-1-answers-Statistics-13.4-5cu
Glencoe-Algebra-1-answers-Statistics-13.4-5cu-1
Answer 5PQ.
Glencoe-Algebra-1-answers-Statistics-13.4-5pq
Glencoe-Algebra-1-answers-Statistics-13.4-5pq-1
Answer 6CU.
Glencoe-Algebra-1-answers-Statistics-13.4-6cu
Answer 7CU.
Glencoe-Algebra-1-answers-Statistics-13.4-7cu
Answer 8CU.
Glencoe-Algebra-1-answers-Statistics-13.4-8cu
Answer 9CU.
Glencoe-Algebra-1-answers-Statistics-13.4-9cu
Answer 10CU.
Glencoe-Algebra-1-answers-Statistics-13.4-10cu
Glencoe-Algebra-1-answers-Statistics-13.4-10cu-1
Answer 11PA.
Glencoe-Algebra-1-answers-Statistics-13.4-11pa
Glencoe-Algebra-1-answers-Statistics-13.4-11pa-1
Answer 12PA.
Glencoe-Algebra-1-answers-Statistics-13.4-12pa
Glencoe-Algebra-1-answers-Statistics-13.4-12pa-1
Answer 13PA.
Glencoe-Algebra-1-answers-Statistics-13.4-13pa
Answer 14PA.
Glencoe-Algebra-1-answers-Statistics-13.4-14pa
Answer 15PA.
Glencoe-Algebra-1-answers-Statistics-13.4-15pa
Glencoe-Algebra-1-answers-Statistics-13.4-15pa-1
Answer 16PA.
Glencoe-Algebra-1-answers-Statistics-13.4-16pa
Glencoe-Algebra-1-answers-Statistics-13.4-16pa-1
Answer 17PA.
Glencoe-Algebra-1-answers-Statistics-13.4-17pa
Glencoe-Algebra-1-answers-Statistics-13.4-17pa-1
Answer 18PA.
Glencoe-Algebra-1-answers-Statistics-13.4-18pa
Glencoe-Algebra-1-answers-Statistics-13.4-18pa-1
Answer 19PA.
Glencoe-Algebra-1-answers-Statistics-13.4-19pa
Glencoe-Algebra-1-answers-Statistics-13.4-19pa-1
Answer 20PA.
Glencoe-Algebra-1-answers-Statistics-13.4-20pa
Glencoe-Algebra-1-answers-Statistics-13.4-20pa-1
Answer 21PA.
Glencoe-Algebra-1-answers-Statistics-13.4-21pa
Glencoe-Algebra-1-answers-Statistics-13.4-21pa-1
Answer 22PA.
Glencoe-Algebra-1-answers-Statistics-13.4-22pa
Glencoe-Algebra-1-answers-Statistics-13.4-22pa-1
Answer 23PA.
Glencoe-Algebra-1-answers-Statistics-13.4-23pa
Glencoe-Algebra-1-answers-Statistics-13.4-23pa-1
Answer 24PA.
Glencoe-Algebra-1-answers-Statistics-13.4-24pa
Glencoe-Algebra-1-answers-Statistics-13.4-24pa-1
Answer 25PA.
Glencoe-Algebra-1-answers-Statistics-13.4-25pa
Glencoe-Algebra-1-answers-Statistics-13.4-25pa-1
Answer 26PA.
Glencoe-Algebra-1-answers-Statistics-13.4-26pa
Glencoe-Algebra-1-answers-Statistics-13.4-26pa-1
Answer 27PA.
Glencoe-Algebra-1-answers-Statistics-13.4-27pa
Glencoe-Algebra-1-answers-Statistics-13.4-27pa-1
Answer 28PA.
Glencoe-Algebra-1-answers-Statistics-13.4-28pa
Glencoe-Algebra-1-answers-Statistics-13.4-28pa-1
Answer 29PA.
Glencoe-Algebra-1-answers-Statistics-13.4-29pa
Glencoe-Algebra-1-answers-Statistics-13.4-29pa-1
Answer 30PA.
Glencoe-Algebra-1-answers-Statistics-13.4-30pa
Glencoe-Algebra-1-answers-Statistics-13.4-30pa-1
Answer 31PA.
Glencoe-Algebra-1-answers-Statistics-13.4-31pa
Glencoe-Algebra-1-answers-Statistics-13.4-31pa-1
Glencoe-Algebra-1-answers-Statistics-13.4-31pa-2
Answer 32PA.
Glencoe-Algebra-1-answers-Statistics-13.4-32pa
Glencoe-Algebra-1-answers-Statistics-13.4-32pa-1
Glencoe-Algebra-1-answers-Statistics-13.4-32pa-2
Answer 33PA.
Glencoe-Algebra-1-answers-Statistics-13.4-33pa
Glencoe-Algebra-1-answers-Statistics-13.4-33pa-1
Answer 34PA.
Glencoe-Algebra-1-answers-Statistics-13.4-34pa
Answer 35PA.
Glencoe-Algebra-1-answers-Statistics-13.4-35pa
Glencoe-Algebra-1-answers-Statistics-13.4-35pa-1
Glencoe-Algebra-1-answers-Statistics-13.4-35pa-2
Answer 36PA.
Glencoe-Algebra-1-answers-Statistics-13.4-36pa
Answer 37PA.
Glencoe-Algebra-1-answers-Statistics-13.4-37pa
Answer 38MYS.
Glencoe-Algebra-1-answers-Statistics-13.4-38mys
Glencoe-Algebra-1-answers-Statistics-13.4-38mys-1
Answer 39MYS.
Glencoe-Algebra-1-answers-Statistics-13.4-39mys
Glencoe-Algebra-1-answers-Statistics-13.4-39mys-1
Answer 40MYS.
Glencoe-Algebra-1-answers-Statistics-13.4-40mys
Glencoe-Algebra-1-answers-Statistics-13.4-40mys-1
Answer 41MYS.
Glencoe-Algebra-1-answers-Statistics-13.4-41mys
Glencoe-Algebra-1-answers-Statistics-13.4-41mys-1
Answer 42MYS.
Glencoe-Algebra-1-answers-Statistics-13.4-42mys
Answer 43MYS.
Glencoe-Algebra-1-answers-Statistics-13.4-43mys
Answer 44MYS.
Glencoe-Algebra-1-answers-Statistics-13.4-44mys
Answer 45MYS.
Glencoe-Algebra-1-answers-Statistics-13.4-45mys
Glencoe-Algebra-1-answers-Statistics-13.4-45mys-1
Answer 46MYS.
Glencoe-Algebra-1-answers-Statistics-13.4-46mys
Glencoe-Algebra-1-answers-Statistics-13.4-46mys-1
Answer 47MYS.
Glencoe-Algebra-1-answers-Statistics-13.4-47mys
Glencoe-Algebra-1-answers-Statistics-13.4-47mys-1

Glencoe Algebra 1 Solutions Chapter 13 Statistics Exercise 13.3

Glencoe Algebra 1 Solutions Chapter 13 Statistics Exercise 13.3


Glencoe Algebra 1 Chapters Answer Key

Glencoe Algebra 1 Solutions Chapter 13 Statistics Exercise 13.3

Answer 1CU.
Glencoe-Algebra-1-answers-Statistics-13.3-1cu
Glencoe-Algebra-1-answers-Statistics-13.3-1cu-1
Glencoe-Algebra-1-answers-Statistics-13.3-1cu-2
Glencoe-Algebra-1-answers-Statistics-13.3-1cu-3
Glencoe-Algebra-1-answers-Statistics-13.3-1cu-4
Answer 2CU.
Glencoe-Algebra-1-answers-Statistics-13.3-2cu
Answer 3CU.
Glencoe-Algebra-1-answers-Statistics-13.3-3cu
Glencoe-Algebra-1-answers-Statistics-13.3-3cu-1
Glencoe-Algebra-1-answers-Statistics-13.3-3cu-2
Glencoe-Algebra-1-answers-Statistics-13.3-3cu-3
Glencoe-Algebra-1-answers-Statistics-13.3-3cu-4
Glencoe-Algebra-1-answers-Statistics-13.3-3cu-5
Answer 4CU.
Glencoe-Algebra-1-answers-Statistics-13.3-4cu
Glencoe-Algebra-1-answers-Statistics-13.3-4cu-1
Answer 5CU.
Glencoe-Algebra-1-answers-Statistics-13.3-5cu
Glencoe-Algebra-1-answers-Statistics-13.3-5cu-1
Glencoe-Algebra-1-answers-Statistics-13.3-5cu-2
Answer 6CU.
Glencoe-Algebra-1-answers-Statistics-13.3-6cu
Glencoe-Algebra-1-answers-Statistics-13.3-6cu-1
Answer 7CU.
Glencoe-Algebra-1-answers-Statistics-13.3-7cu
Glencoe-Algebra-1-answers-Statistics-13.3-7cu-1
Glencoe-Algebra-1-answers-Statistics-13.3-7cu-2
Answer 8CU.
Glencoe-Algebra-1-answers-Statistics-13.3-8cu
Glencoe-Algebra-1-answers-Statistics-13.3-8cu-1
Glencoe-Algebra-1-answers-Statistics-13.3-8cu-2
Answer 9CU.
Glencoe-Algebra-1-answers-Statistics-13.3-9cu
Glencoe-Algebra-1-answers-Statistics-13.3-9cu-1
Glencoe-Algebra-1-answers-Statistics-13.3-9cu-2
Glencoe-Algebra-1-answers-Statistics-13.3-9cu-3
Answer 10PA.
Glencoe-Algebra-1-answers-Statistics-13.3-10pa
Glencoe-Algebra-1-answers-Statistics-13.3-10pa-1
Answer 11PA.
Glencoe-Algebra-1-answers-Statistics-13.3-11pa
Glencoe-Algebra-1-answers-Statistics-13.3-11pa-1
Answer 12PA.
Glencoe-Algebra-1-answers-Statistics-13.3-12pa
Glencoe-Algebra-1-answers-Statistics-13.3-12pa-1
Answer 13PA.
Glencoe-Algebra-1-answers-Statistics-13.3-13pa
Glencoe-Algebra-1-answers-Statistics-13.3-13pa-1
Answer 14PA.
Glencoe-Algebra-1-answers-Statistics-13.3-14pa
Glencoe-Algebra-1-answers-Statistics-13.3-14pa-1
Answer 15PA.
Glencoe-Algebra-1-answers-Statistics-13.3-15pa
Glencoe-Algebra-1-answers-Statistics-13.3-15pa-1
Answer 16PA.
Glencoe-Algebra-1-answers-Statistics-13.3-16pa
Glencoe-Algebra-1-answers-Statistics-13.3-16pa-1
Glencoe-Algebra-1-answers-Statistics-13.3-16pa-2
Answer 17PA.
Glencoe-Algebra-1-answers-Statistics-13.3-17pa
Glencoe-Algebra-1-answers-Statistics-13.3-17pa-1
Glencoe-Algebra-1-answers-Statistics-13.3-17pa-2
Answer 18PA.
Glencoe-Algebra-1-answers-Statistics-13.3-18pa
Answer 19PA.
Glencoe-Algebra-1-answers-Statistics-13.3-19pa
Glencoe-Algebra-1-answers-Statistics-13.3-19pa-1
Answer 20PA.
Glencoe-Algebra-1-answers-Statistics-13.3-20pa
Answer 24PA.
Glencoe-Algebra-1-answers-Statistics-13.3-24pa
Answer 25PA.
Glencoe-Algebra-1-answers-Statistics-13.3-25pa
Answer 26PA.
Glencoe-Algebra-1-answers-Statistics-13.3-26pa
Glencoe-Algebra-1-answers-Statistics-13.3-26pa-1
Glencoe-Algebra-1-answers-Statistics-13.3-26pa-2
Answer 27PA.
Glencoe-Algebra-1-answers-Statistics-13.3-27pa
Glencoe-Algebra-1-answers-Statistics-13.3-27pa-1
Glencoe-Algebra-1-answers-Statistics-13.3-27pa-2
Answer 28PA.
Glencoe-Algebra-1-answers-Statistics-13.3-28pa
Glencoe-Algebra-1-answers-Statistics-13.3-28pa-1
Glencoe-Algebra-1-answers-Statistics-13.3-28pa-2
Answer 29PA.
Glencoe-Algebra-1-answers-Statistics-13.3-29pa
Glencoe-Algebra-1-answers-Statistics-13.3-29pa-1
Glencoe-Algebra-1-answers-Statistics-13.3-29pa-2
Answer 30MYS.
Glencoe-Algebra-1-answers-Statistics-13.3-30mys
Answer 31MYS.
Glencoe-Algebra-1-answers-Statistics-13.3-31mys
Glencoe-Algebra-1-answers-Statistics-13.3-31mys-1
Answer 32MYS.
Glencoe-Algebra-1-answers-Statistics-13.3-32mys
Answer 33MYS.
Glencoe-Algebra-1-answers-Statistics-13.3-33mys
Answer 34MYS.
Glencoe-Algebra-1-answers-Statistics-13.3-34mys
Glencoe-Algebra-1-answers-Statistics-13.3-34mys-1
Answer 35MYS.
Glencoe-Algebra-1-answers-Statistics-13.3-35mys
Answer 36MYS.
Glencoe-Algebra-1-answers-Statistics-13.3-36mys
Answer 37MYS.
Glencoe-Algebra-1-answers-Statistics-13.3-37mys
Answer 38MYS.
Glencoe-Algebra-1-answers-Statistics-13.3-38mys
Answer 39MYS.
Glencoe-Algebra-1-answers-Statistics-13.3-39mys
Answer 40MYS.
Glencoe-Algebra-1-answers-Statistics-13.3-40mys
Answer 41MYS.
Glencoe-Algebra-1-answers-Statistics-13.3-41mys
Answer 42MYS.
Glencoe-Algebra-1-answers-Statistics-13.3-42mys
Answer 43MYS.
Glencoe-Algebra-1-answers-Statistics-13.3-43mys