What is the meaning of Classmark and Prepare a Discrete Frequency Distribution

What is the meaning of Classmark and Prepare a Discrete Frequency Distribution

Important Points

  1. The word data means information. Statistical data are of two types :
    (i) Primary data
    (ii) Secondary data
  2. When an investigator collects data himself with a definite plan or design in his (her) mind, it is called Primary data.
  3. Data which are not originally collected rather obtained from published or unpublished sources are known as Secondary data.
  4. After collection of data, the investigator has to find ways to condense them in tabular form in order to study their salient features. Such an arrangement is called Presentation of data.
  5. Raw data (if the data is arranged in the manner as it was collected, then it is called as Raw data) when put in ascending or descending order of magnitude is called an array or arranged data.
  6. The number of times an observation occurs in the given data is called frequency of the observation
    Classes/class intervals are the groups in which all the observations are divided.
  7. Suppose class-interval is 10-20, then 10 is called lower limit and 20 is called upper limit of the class.
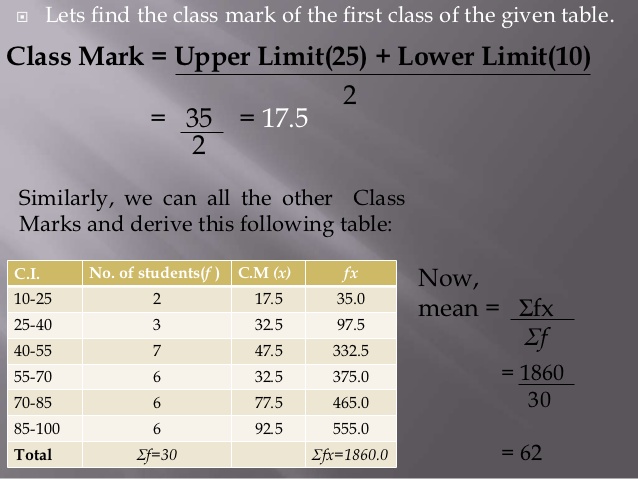
  8. Mid-value of class-interval is called Class-mark.
    Class-mark = \(\frac { Lower\quad limit+Upper\quad limit }{ 2 } \)
    Class-mark = lower limit + \(\frac { 1 }{ 2 } \)
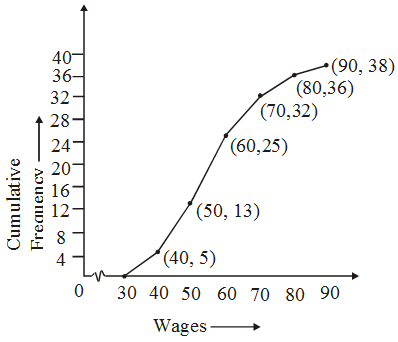
    (difference between the upper and lower limits)
  9. If the frequency of first class interval is added to the frequency of second class and this sum is added to third class and so on then frequencies so obtained are known as Cumulative Frequency (c.f.).
  10. There are two types of cumulative frequencies (a) less than, (b) greater than.

Read  More:

Discrete Frequency Distribution Example Problems with Solutions

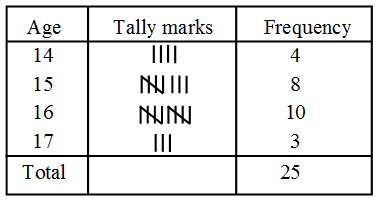
Example 1:    Given below are the ages of 25 students of class IX in a school. Prepare a discrete frequency distribution.
15, 16, 16, 14, 17, 17, 16, 15, 15, 16, 16, 17, 15, 16, 16, 14, 16, 15, 14, 15, 16, 16, 15, 14, 15.
Solution:    Frequency distribution of ages of 25 students
What is the meaning of Classmark and Prepare a Discrete Frequency Distribution 1

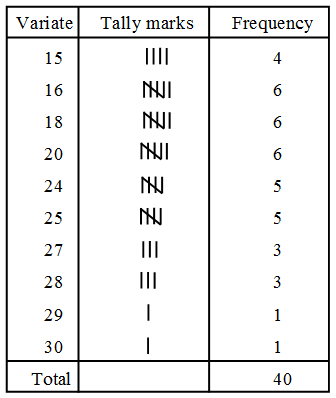
Example 2:    Form a discrete frequency distribution from the following scores:-
15, 18, 16, 20, 25, 24, 25, 20, 16, 15, 18, 18, 16, 24, 15, 20, 28, 30, 27, 16, 24, 25, 20, 18, 28, 27, 25, 24, 24, 18, 18, 25, 20, 16, 15, 20, 27, 28, 29, 16.
Solution:    
What is the meaning of Classmark and Prepare a Discrete Frequency Distribution 2

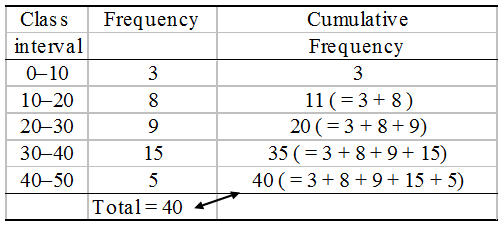
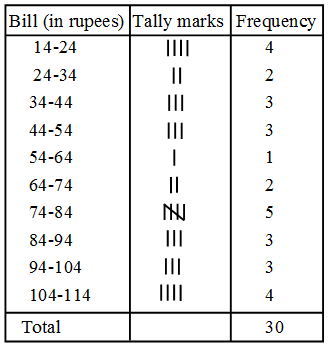
Example 3:    The water tax bills (in rupees) of 30 houses in a locality are given below. Construct a grouped frequency distribution with class size of 10.
30, 32, 45, 54, 74, 78, 108, 112, 66, 76, 88, 40, 14, 20, 15, 35, 44, 66, 75, 84, 95, 96, 102, 110, 88, 74, 112, 14, 34, 44.
Solution:    Here the maximum and minimum values of the variate are 112 and 14 respectively.
∴ Range = 112 – 14 = 98.
It is given that the class size is 10, and
\(\frac { Range }{ Class\quad size } =\frac { 98 }{ 10 } \) = 9.8
So, we should have 10 classes each of size 10. If we take the first class as 14-24 it includes the minimum value 14. If the last class is taken as 104-114, then it includes the maximum value 112. In the class 14-24, 14 is included but 24 is excluded. Similarly, in other classes, the lower limit is included and the upper limit is excluded. Now
What is the meaning of Classmark and Prepare a Discrete Frequency Distribution 3

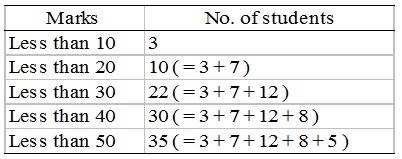
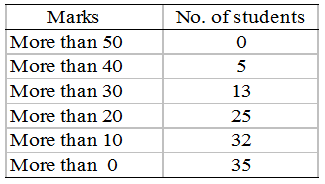
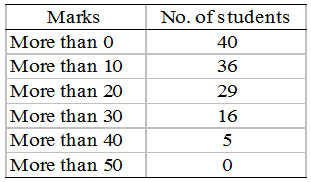
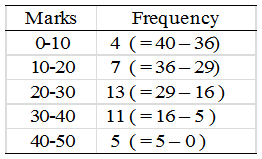
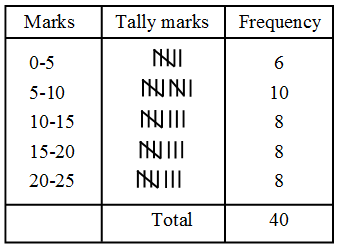
Example 4:    The marks obtained by 40 students of class IX in an examination are given below :
18, 8, 12, 6, 8, 16, 12, 5, 23, 2,16, 23, 2, 10, 20, 12, 9, 7, 6, 5, 3, 5, 13, 21, 13, 15, 20, 24, 1, 7, 21, 16, 13, 18, 23, 7, 3, 18, 17, 16.
Present the data in the form of a frequency distribution using the same class size, one such class being 15-20 (where 20 is not included)
Solution:    Frequency Distribution of Marks
What is the meaning of Classmark and Prepare a Discrete Frequency Distribution 4

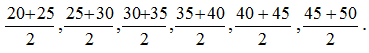
Example 5:     The class marks of a distribution are :
47, 52, 57, 62, 67, 72, 77, 82, 87, 92, 97, 102 Determine the class size, the class limits and the true class limits.
Solution:    Here the class marks are uniformly spaced. So, the class size is the difference between any two consecutive class marks
∴ Class size = 52 – 47 = 5
We know that, if a is the class mark of a class interval and h is its class size, then the lower and upper limits of the class interval are
\(a-\frac { h }{ 2 } \) and \(a+\frac { h }{ 2 } \)  respectively.
∴ Lower limit of first class interval
= \(47-\frac { 5 }{ 2 } \)
= 44.5
And, upper limit of first class interval
= \(47+\frac { 5 }{ 2 } \)
= 49.5
So, first class interval is 44.5 – 49.5
Similarly, we obtain the other class limits as given under :
What is the meaning of Classmark and Prepare a Discrete Frequency Distribution 5
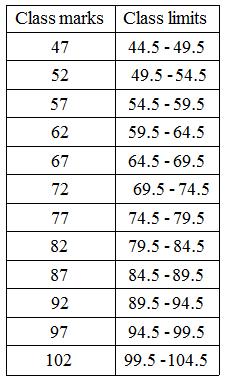
Since the classes are exclusive, so the true class limits are same as the class limits.

Example 6:    The class marks of a distribution are  26, 31, 36, 41, 46, 51, 56, 61, 66, 71. Find the true class limits.
Solution:    Here the class marks are uniformly spaced. So, the class size is the difference between any two consecutive class marks.
∴ Class size = 31 – 26 = 5.
If a is the class mark of a class interval of size h, then the lower and upper limits of the class interval are \(a-\frac { h }{ 2 } \) and \(a+\frac { h }{ 2 } \) respectively.
Here     h = 5
∴ Lower limit of first class interval
= \(26-\frac { 5 }{ 2 } \) = 23.5
And, upper limit of first class interval
= \(26+\frac { 5 }{ 2 } \) = 28.5
∴ First class interval is 23.5 – 28.5.
Thus, the class intervals are:
23.5 – 28.5, 28.5 – 33.5, 33.5 – 38.5, 38.5 – 43.5, 43.5 – 48.5, 48.5 – 53.5
Since the class are formed by exclusive method. Therefore, these limits are true class limits.

Example 6:     The class marks of a distribution are 82, 88, 94, 100, 106, 112 and 118. Determine the class size and the classes.
Solution:    The class size is the difference between two consecutive class marks.
∴ Class size = 88 – 82 = 6.
Now 82 is the class mark of the first class whose width is 6.
∴ Class limits of the first class are \(82-\frac { 6 }{ 2 } \) and \(82+\frac { 6 }{ 2 } \) i.e. 79 and 85.
Thus, the first class is 79-85. Similarly, the other classes are 85–91, 91– 97, 97–103,
103 –109, 109 –115 and 115 –121.

Example 7:     The class marks of a distribution are 13, 17, 21, 25 and 29. Find the true class limits.
Solution:    The class marks are 13, 17, 21, 25 and 29.
The class marks are uniformly spaced.
Class size = difference between two consecutive class marks
= 17 – 13 = 4
Half of the class size = \(\frac { 4 }{ 2 } \) = 2
To find the classes one has to subtract 2 from and add 2 to each of the class marks.
Hence, the classes are
11– 15

15 – 19

19 – 23

23 – 27

27 – 31
Since the classes are exclusive, the true class limits are the same as the class limits. So the lower class limits as well as the true lower class limits are 11, 15, 19, 23 and 27. The upper class limits as well as the true upper class limits are 15, 19, 23, 27 and 31.

Example 8:     Find the unknown entries (a,b,c,d,e,f,g) from the following frequency distribution of heights of 50 students in a class :
What is the meaning of Classmark and Prepare a Discrete Frequency Distribution 7
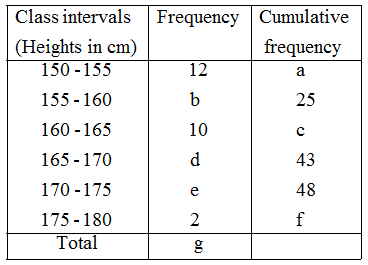
Solution:    Since the given frequency distribution is the frequency distribution of heights of 50 students. Therefore,
∴ g = 50.
From the table, we have
a = 12, b + 12 = 25, 12 + b + 10 = c,
⇒ 12 + b + 10 + d = 43,
⇒ 12 + b + 10 + d + e = 48 and
⇒ 12 + b + 10 + d + e + 2 = f
Now, b + 12 = 25
⇒ b = 13
12 + b + 10 = c
⇒ 12 + 13 + 10 = c         [∵ b = 13]
⇒ c = 35
12 + b + 10 + d = 43
⇒ 12 + 13 + 10 + d = 43             [∵ b = 13]
⇒ d = 8
12 + b + 10 + d + e = 48
⇒ 12 + 13 + 10 + 8 + e = 48      [∵ b = 13, d = 8]
⇒ e = 5
and, 12 + b + 10 + d + e + 2 = f
⇒ 12 + 13 + 10 + 8 + 5 + 2 = f
⇒ f = 50.
Hence, a = 12, b = 13, c = 35, d = 8,
e = 5, f = 50 and g = 50.           

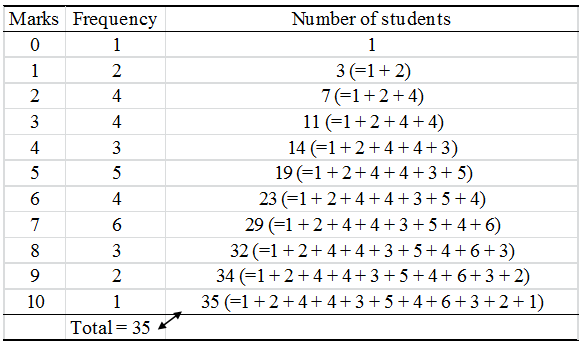
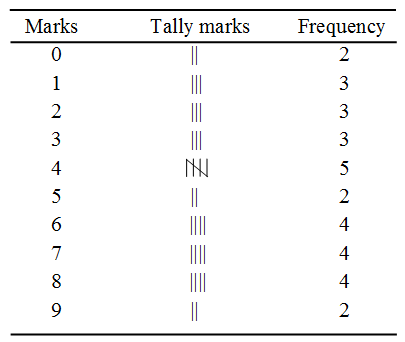
Example 9:     The marks out of 10 obtained by 32 students are : 2, 4, 3, 1, 5, 4, 3, 8, 9, 7, 8, 5, 4, 3, 6, 7, 4, 7, 9, 8, 6, 4, 2, 1, 0, 0, 2, 6, 7, 8, 6, 1.
Array the data and form the frequency distribution
Solution:    An array of the given data is prepared by arranging the scores in ascending order as follows :
0, 0,     1, 1, 1,   2, 2, 2,     3,3,3,     4,4,4,4,4,
5,5,      6,6,6,6,    7,7,7,7,    8,8,8,8,   9,9.
Frequency distribution of the marks is shown below.
What is the meaning of Classmark and Prepare a Discrete Frequency Distribution 8

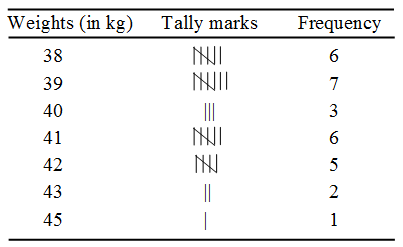
Example 10:     Prepare a discrete frequency distribution from the data given below, showing the weights in kg of 30 students of class VI.
39, 38, 42, 41, 39, 38, 39, 42, 41, 39, 38, 38 41, 40, 41, 42, 41, 39, 40, 38, 42, 43, 45, 43, 39, 38, 41, 40, 42, 39.
Solution:    The discrete frequency distribution table for the weight (in kg) of 30 students is shown below.
What is the meaning of Classmark and Prepare a Discrete Frequency Distribution 9

What is Cumulative Frequency in statistics

What is Cumulative Frequency in statistics

  • If the frequency of first class interval is added to the frequency of second class and this sum is added to third class and so on then frequencies so obtained are known as Cumulative Frequency (c.f.).
  • There are two types of cumulative frequencies (a) less than, (b) greater than    
  • A table which displays the manner in which cumulative frequencies are distributed over various classes is called a cumulative frequency distribution or cumulative frequency table.
  • There are two types of cumulative frequency.
    (1)  Less than type
    (2) Greater than type

Read  More:

Cumulative Frequency Table Example Problems with Solutions

Example 1:    The marks obtained by 35 students in a class are given below. Construct the cumulative frequency table :

Marks obtainedNumber of students
01
12
24
34
43
55
64
76
83
92
101

Solution:
What is Cumulative Frequency in statistics 1

Example 2:    The distribution of ages (in years) of 40 persons in a colony is given below.

Age (in years)Number of Persons
20-257
25-3010
30-358
35-406
40-454
45-505

(a) Determine the class mark of each class
(b) What is the upper class limit of 4th class
(c) Determine the class size
Solution:    (a) Class marks are
What is Cumulative Frequency in statistics 2
= 22.5, 27.5, 32.5, 37.5, 42.5, 47.5
(b)  The fourth class interval is 35–40. Its upper limit is 40
(c)  The class size is 25 – 20 = 5

Example 3:    Following is the distribution of marks of 40 students in a class. Construct a cumulative frequency distribution table.

MarksNumber of Students
0-103
10-208
20-309
30-4015
40-505

Solution:
What is Cumulative Frequency in statistics 3

Example 4:    The class marks of a distribution are 25, 35, 45, 55, 65 and 75. Determine the class size and class limit.
Solution:    Class size = The difference between the class marks of two adjacent classes.
= 35 – 25
= 10
We need classes of size 10 with class marks as 25, 35, 45, 55, 65, 75
The class limits for the first class are
25 –  \(\frac { 10 }{ 2 }\) and 25 + \(\frac { 10 }{ 2 }\)
i.e. 20 and 30
First class is, therefore, 20–30
Similarly, the other classes are 30 – 40, 40 – 50, 50 – 60, 60 – 70, 70 – 80.

Example 5:   Given below is the cumulative frequency distribution table showing the marks secured by 40 students.

MarksNumber of Students
Below 205
Below 4010
Below 6025
Below 8032
Below 10040

Show in the class and their frequency form.
Solution:

MarksCumulative frequencyFrequency
0-2055
20-40105 ( = 10 -5)
40-602515 ( = 25 – 10)
60-80327 ( = 32 – 25)
80-100408 (= 40 – 32)

Example 6:    Write down less than type cumulative frequency and greater than type cumulative frequency.

Height  (in cm)Frequency
140 – 14510
145 – 15012
150 – 15518
155 – 16035
160 – 16545
165 – 17038
170 – 17522
175 – 18020

Solution:    We have

Height           (in cm)140–145145–150150–155155–160160–165165–170170–175175–180
Frequency1012183545382220
Height     Less than type145150155160165170175180
Cumulative  frequency10224075120158180200
Height Greater than type140145150155160165170175
Cumulative  frequency200190178160125804220

Example 7:    The distances (in km) covered by 24 cars in 2 hours are given below :
125, 140, 128, 108, 96, 149, 136, 112, 84, 123, 130, 120, 103, 89, 65, 103, 145, 97, 102, 87, 67, 78, 98, 126
Represent them as a cumulative frequency table using 60 as the lower limit of the first group and all the classes having the class size of 15.
Solution:    We have, Class size = 15
Maximum distance covered = 149 km.
Minimum distance covered = 65 km.
Range = (149 – 65) km = 84 km.
So, number of classes = 6 (since \(\frac { 84 }{ 15 }  \) = 5.6
Thus, the class intervals are 60-75, 75-90,90-105, 105-120, 120-135, 135-50.
The cumulative frequency distribution is as given below :
What is Cumulative Frequency in statistics 4

Example 8:    The following table gives the marks scored by 378 students in an entrance examination :
What is Cumulative Frequency in statistics 5
From this table form (i) the less than series, and (ii) the more than series.
Solution:    (i)   Less than cumulative frequency table
What is Cumulative Frequency in statistics 6
 (ii) More than cumulative frequency table
What is Cumulative Frequency in statistics 7

Example 9:    Convert the given simple frequency series into a:
(i)   Less than cumulative frequency series.
(ii)  More than cumulative frequency series.

MarksNo. of students
0-103
10-207
20-3012
30-408
40-505

Solution:    (i)  Less than cumulative frequency series
What is Cumulative Frequency in statistics 8
(ii)  More than cumulative frequency series
What is Cumulative Frequency in statistics 9

Example 10:    Convert the following more than cumulative frequency series into simple frequency series.
What is Cumulative Frequency in statistics 10
Solution:    Simple frequency distribution table
What is Cumulative Frequency in statistics 11

Example 11:    Drawn ogive for the following frequency distribution by less than method  

Marks0-1010-2020-3030-4040-5050-60
No. of Students710235163

Solution:    We first prepare the cumulative frequency distribution table by less than method as given below :

Marks0-1010-2020-3030-4040-5050-60
No. of Students710235162
Marks less than102030405060
Cumulativefrequency717409197100

Other than the given class intervals, we assume a class – 10-0 before the first class interval 0-10 with zero frequency.
Now, we mark the upper class limits (including the imagined class) along X-axis on a suitable scale and the cumulative frequencies along Y-axis on a suitable scale.
Thus, we plot the points
(0, 0), (10, 7), (20, 17), (30, 40), (40, 91), (50,97), and (60, 100)
What is Cumulative Frequency in statistics 12
Now, we join the plotted points by a free hand curve to obtain the required ogive.

Example 12:    Draw a cumulative frequency curve for the following frequency distribution by less than method

    Age (in years)0-910-1920-2930-3940-4950-5960-69
   No. of persons:515202317119

Solution:    The given frequency distribution is not continuous. So, we first make it continuous and prepare the cumulative frequency distribution as under :

Age (in years) FrequencyAge less thanCumulative frequency 
0.5 – 9.559.55
9.5 – 19.51519.520
19.5 – 29.52029.540
29.5 – 39.52339.563
39.5 – 49.51749.580
49.5 – 59.51159.591
59.5 – 69.5969.5100

Now, we plot points (9.5, 5), (19.5, 20), (29.5,40), (39.5, 63), (49.5, 80), (59.5, 91) and (69.5, 100) and join them by a free hand smooth curve to obtain the required ogive as shown in Fig.
What is Cumulative Frequency in statistics 13

Example 13:    The temperature of a patient, admitted in a hospital with typhoid fever, taken at different times of the day are given below. Draw the temperature-time graph to reprents the data:

  Time (in hours)6:008:0010:0012:0014:0016:0018:00
Temperature  (in °F)1021009910310010299

Solution:    In order to draw the temperature-time graph, we represent time (in hours) on the x-axis and the temperature in ºF on the y-axis. We first plot the ordered pairs (6, 102), (8, 100),      (10, 99), (12, 103), (14, 100), (16, 102) and (18, 99) as points and then join them by line segments as shown in Fig.
What is Cumulative Frequency in statistics 14

Example 14:    The graph shown in Fig. exhibits the rate of interest on fixed deposite upto one year announced by the reserve bank of india in different years. Read the graph and find.
(i)   In which period was the rate of interest maximum?
(ii)  In which period was the rate of interest minimum ?
What is Cumulative Frequency in statistics 15
Solution:    In the graph, we find that years are represented on x-axis and the rate of interest per annum is along y-axis. From the graph, we find that
(i)   The rate of interest was maximum (12%) in 1996.
(ii)  The minimum rate of interest was 6.5% in the year 2002.

Example 15:    The following data represents the wages of 25 workers of a certain factory :

Wages (in rupees) No. of workers
30-405
40-508
50-6012
60-707
70-804
80-902

Solution:    The cumulative frequency table is constructed as follows :

Wages (in rupees)No. of workersCumulative frequency
30-4055
40-50813
50-601225
60-70732
70-80436
80-90238

The cumulative frequency curve is shown below:
What is Cumulative Frequency in statistics 16

Example 16:    Draw the Time-Temperature graph from the following table

Time (in hour)Temperature (in °C)
10-0021
11-0023
12-0025
13-0027
14-0028
15-0026

From the graph estimate the temperature at 11-30 a.m.
Solution:    Time in hours is denoted along the X-axis and temperature (in °C) is inidicated along the Y-axis. The points are joined by drawing a freehand curve. From the graph, the temperature at 11-30 a.m. is found to be 24.0°C.
What is Cumulative Frequency in statistics 17