Correlation
The relationship between two variables such that a change in one variable results in a positive or negative change in the other variable is known as correlation.
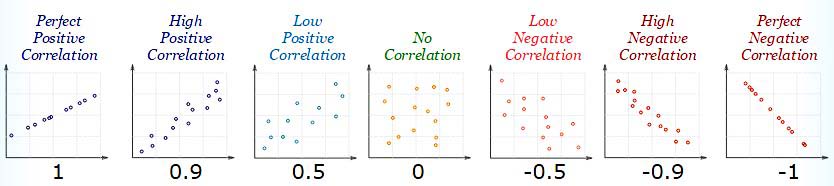
Types of correlation
- Perfect correlation: If the two variables vary in such a manner that their ratio is always constant, then the correlation is said to be perfect.
- Positive or direct correlation: If an increase or decrease in one variable corresponds to an increase or decrease in the other, the correlation is said to be positive.
- Negative or indirect correlation: If an increase or decrease in one variable corresponds to a decrease or increase in the other, the correlation is said to be negative.
Karl Pearson’s coefficient of correlation
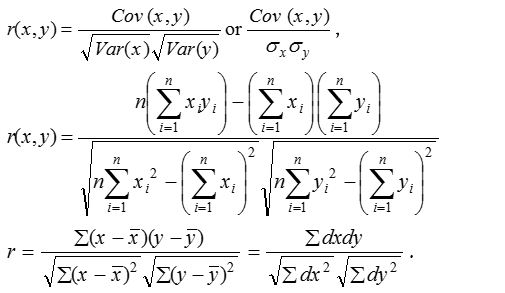
The correlation coefficient r(x, y), between two variable x and y is given by,
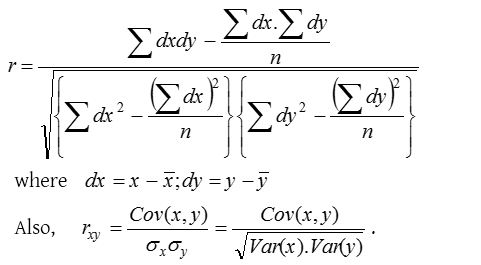
Modified formula
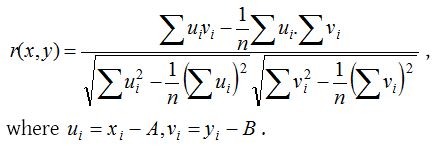
Step deviation method
Let A and B are assumed mean of xi and yi respectively, then
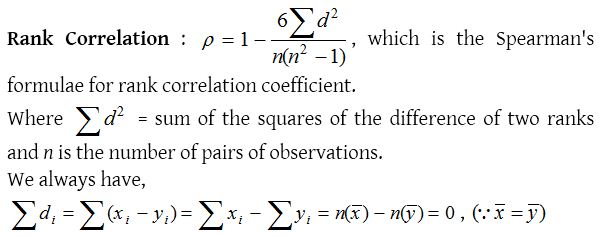
Rank correlation
Let us suppose that a group of n individuals is arranged in order of merit or proficiency in possession of two characteristics A and B.
These rank in two characteristics will, in general, be different.
For example, if we consider the relation between intelligence and beauty, it is not necessary that a beautiful individual is intelligent also.
If all d’s are zero, then r = 1, which shows that there is perfect rank correlation between the variable and which is maximum value of r. If however some values of xi are equal, then the coefficient of rank correlation is given by
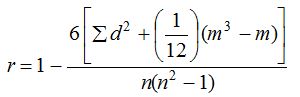
where m is the number of times a particular xi is repeated.
Positive and Negative rank correlation coefficients
Let r be the rank correlation coefficient then, if r > 0, it means that if the rank of one characteristic is high, then that of the other is also high or if the rank of one characteristic is low, then that of the other is also low.
- r = 1, it means that there is perfect correlation in the two characteristics i.e., every individual is getting the same ranks in the two characteristics.
- r < 1, it means that if the rank of one characteristics is high, then that of the other is low or if the rank of one characteristics is low, then that of the other is high.
- r = –1, it means that there is perfect negative correlation in the two characteristics i.e, an individual getting highest rank in one characteristic is getting the lowest rank in the second characteristic. Here the rank, in the two characteristics in a group of n individuals are of the type (1, n), (2, n – 1), ….., (n, 1).
- r = 0, it means that no relation can be established between the two characteristics.
Standard error and probable error
(1) Standard error of prediction:
The deviation of the predicted value from the observed value is known as the standard error prediction and is defined as
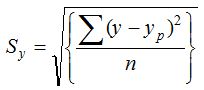
where y is actual value and yp is predicted value.
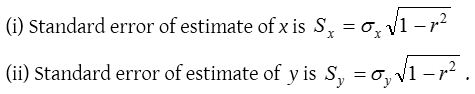
In relation to coefficient of correlation, it is given by
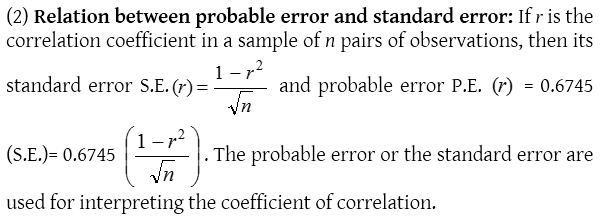
- If r < P.E.(r), there is no evidence of correlation.
- If r < 6P.E.(r), the existence of correlation is certain.
The square of the coefficient of correlation for a bivariate distribution is known as the “Coefficient of determination”.