Kerala Plus One Economics Chapter Wise Previous Questions Chapter 17 Correlation
Question 1.
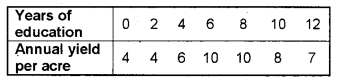
Calculate the correlation coefficient between years of education of farmers and annual yield per acre and comment on the result. (Say 2009)
Answer:
Formula: \(r=\frac{\Sigma x y}{\sqrt{\Sigma x^{2} \cdot \Sigma y^{2}}}\)
Answer: r = 0.64
This is a positive correlation.
Question 2.
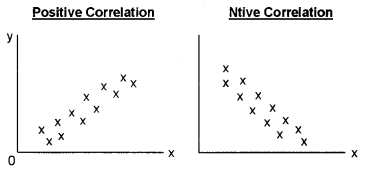
Draw the scatter diagrams showing the positive and negative correlation. (March 2010)
Answer:
Question 3.
Calculate the correlation coefficient between X and Y and comment on their relationship. (March 2010)
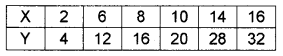
Answer:
Karl Pearson’s coefficient of correlation
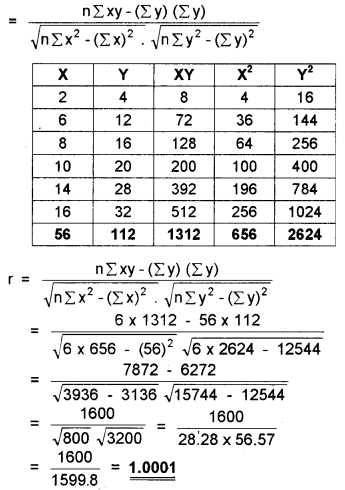
Perfect Positive Correlation
Question 4.
Read the following sentences and answer the questions given below: (March 2011)
a) When income rises, consumption also rises.
b) When the price of oranges falls, its demand rises.
c) A rise in the price of petrol does not influence the demand for cars.
Questions:
i) Name the type of correlation related to each of these sentences.
ii) Draw the scatter diagrams.
Answer:
i) a → Positive correlation
b → Negative correlation
c → No correlation
a) Positive Correlation
b) Negative Correlation
c) No Correlation
Question 5.
Interpret the following co-efficients of correlation. (March 2012)
a) r = 0
b) r = -1
c) r = 1
d) r = 0.2
Answer:
a) r = 0: no correlation
b) r = -1: perfect negative correlation
c) r = +1: perfect positive correlation
d) r = 0.2: low positive correlation
Question 6.
Give one example each for the positive and negative correlation. (March 2012)
Answer:
Positive Correlation
- The relation between price and supply
- The relation between height and weight
Negative correlation
- The relation between price and demand
- Sale of woolen garment and day temperature
Question 7.
From a scatter, diagram one can get a fairly good idea of the nature of the relationship between two variables. Discuss the relationship with the help of the diagrams. (Say 2012)
Answer:
A scatter diagram is a tool for analyzing relationships between two variables. One variable is plotted on the horizontal axis and the other is plotted on the vertical axis. The pattern of their intersecting points can graphically show relationship patterns.
Most often a scatter diagram is used to prove or disprove cause and effect relationships. While the diagram shows relationships, it does not by itself prove that one variable causes the other. In addition to showing possible cause and effect relationships, a scatter diagram can show that two variables are from a common cause that is unknown or that one variable can be used as a surrogate for the other.
Interpret the data. Scatter diagrams will generally show one of six possible correlations between the variables:
- Strong Positive Correlation = The value of Y clearly increases as the value of X increases.
- Strong Negative = Correlation The value of Y clearly decreases as the value of X increases.
- Weak Positive Correlation = The value of Y increases slightly as the value of X increases.
- Weak Negative Correlation = The value of Y decreases slightly as the value of X increases.
- Complex Correlation T = The value of Y seems to be related to the value of X, but the relationship is not easily determined.
- No Correlation = There is no demonstrated connection between the two variables.
Question 8.
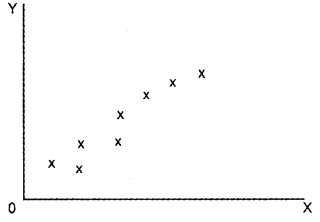
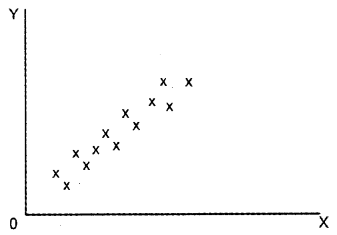
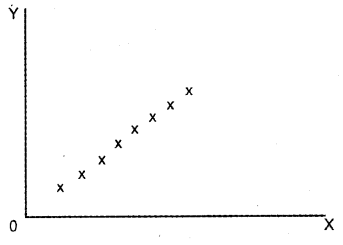
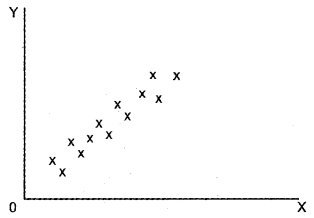
Athira plotted the values of two variables X and Y in a scatter diagram as follows. The nature of correlation here is ________ (March 2013)
a) Perfect positive
b) Perfect negative
c) Positive
d) Negative
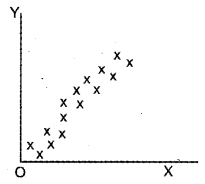
Answer:
c) Positive
Question 9.
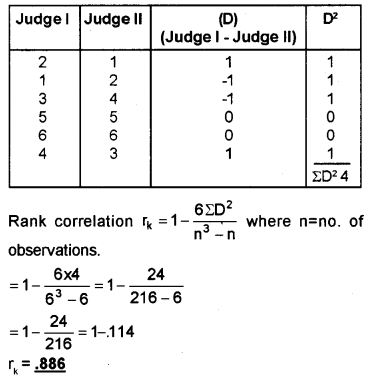
The ranks given by two judges to the six participants of the Kuctiipudi competition in the Subdistrict School Kalolsavam, 2012 are: (March 2013)
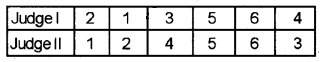
Find the correlation between the two judgments.
Answer:
Question 10.
Using the scatter diagram, represent the following types of correlation. (Say 2013)
a) Positive correlation
b) Negative correlation
c) No correlation
d) Perfect positive correlation
e) Perfect negative correlation
Answer:
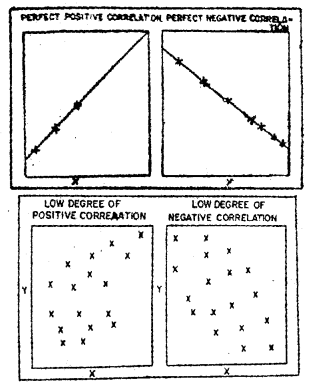
a) Positive correlation
b) Negative correlation
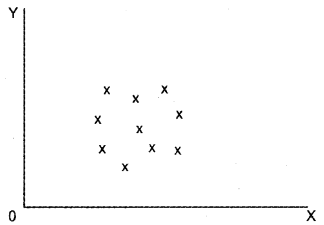
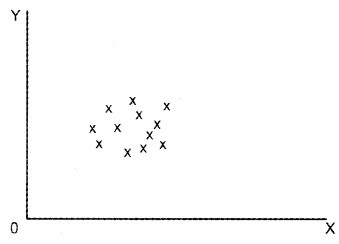
c) No correlation
d) Perfect positive correlation
e) Perfect negative correlation
Question 11.
Mention three techniques for studying correlation. (March 2014)
Answer:
- Karl Pearson’s coefficient of correlation
- Spearman’s rank correlation
- Scatter diagram
Question 12.
When the coefficient of correlation, r = 0, there is __________ (March 2014)
a) positive correlation
b) no correlation
c) negative correlation
d) none of these
Answer:
b) no correlation
Question 13.
Correlation measures the direction and intensity of a relationship among variables. (Say 2014)
a) Recommend any two techniques for measuring correlation.
b) Point out two examples each for positive correlation and negative correlation from a real-life situation.
Answer:
a) i) Scatter diagram
ii) Karl Pearson’s coefficient of correlation
b) Positive Correlation
- The relation between price and supply
- The relation between height and weight
Negative Correlation
- The relation between price and demand
- Sale of woolen garment and day temperature
Question 14.
Scatter diagrams show the visual presentation of correlation. (March 2015)
a) Draw scatter diagrams showing positive correlation and negative correlation.
b) Point out one example each for positive correlation and negative correlation.
Answer:
a) i) Positive Correlation
ii) Perfect Positive Correlation
b) Positive Correlation
- The relation between price and supply
- The relation between height and weight
Negative Correlation
- The relation between price and demand
- Sale of woolen garment and day temperature
Question 15.
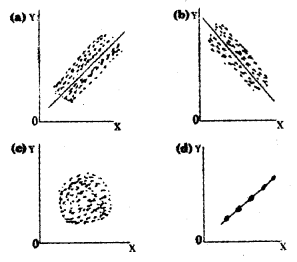
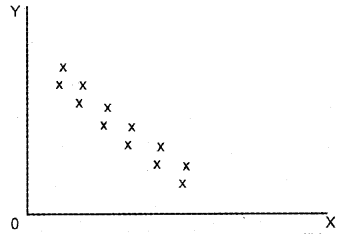
a) Write the types of correlations represented by the above diagrams.
b) Write the types of correlations in the following cases:
i) When income rises, consumption also rises
ii) When the price of apples falls, its demand increases (Say 2015)
Answer:
a) i) Positive correlation
ii) Negative correlation
iii) No correlation
iv) Perfect positive correlation
b) i) Positive correlation
ii) Negative correlation
Question 16.
Write three techniques for studying correlation. (March 2016)
Answer:
- Scatter diagram
- Karl Pearson’s coefficient of correlation
- Spearman’s rank correlation
Question 17.
When the coefficient of correlation r = 0, there is _________ (March 2016)
a) positive correlation
b) no correlation
c) negative correlation
d) none of these
Answer:
b) no correlation
Question 18.
True or False. (Say 2016)
The value of ‘r’ lies between ± 1.
Answer:
True
Question 19.
Draw scatter diagram to represent the following: (Say 2016)
a) Positive correlation
b) Negative correlation
c) Perfect positive correlation
d) Perfect negative correlation
Answer:
a) Positive correlation
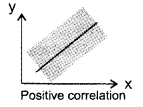
When x rises Y will also rise. This is a positive correlation.
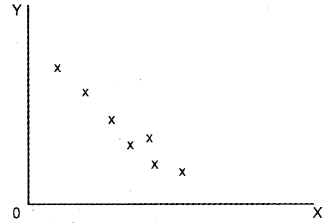
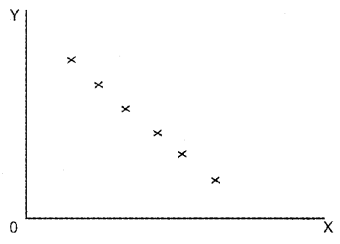
b) Negative correlation
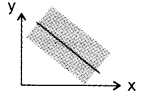
When the variables move in opposite directions, this is a negative correlation.
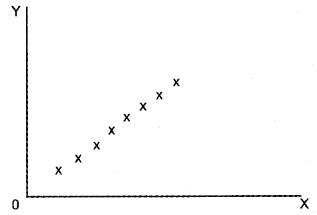
c) Perfect positive correlation
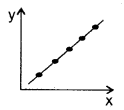
In this correlation, the points are concentrated in an upward rising line.
d) Perfect negative correlation
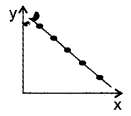
In a perfect negative correlation, the points lie on a downward sloping straight line.
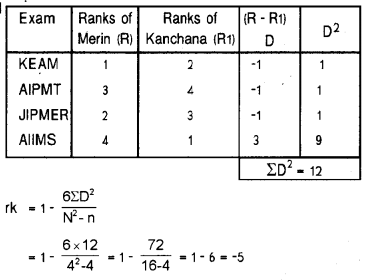
Question 20.
The various ranks secured by Merin and Kanchana in four medical entrance examinations are ________ (March 2017)
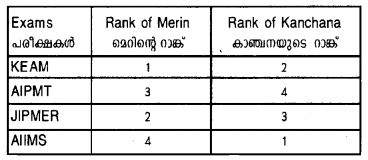
Calculate the rank correlation and interpret the result.
Answer:
Question 21.
A value of correlation coefficient (r) = +1.2 indicates (March 2017)
a) Perfect +ve correlation
b) High degree of +ve correlation
c) Low degree of +ve correlation
d) Error in calculation
Answer:
d) Error in calculation