Kerala Plus One Economics Chapter Wise Previous Questions Chapter 16 Measures of Dispersion
Question 1.
Pick the odd one out: (March 2009)
Standard deviation, Mean Deviation, Arithmetic mean, Quartile deviation.
Answer:
Arithmetic mean
Question 2.
Rewrite the following statement correctly: (March 2009)
The range is affected the least by extreme values.
Answer:
The range is affected the most by extreme values.
Question 3.
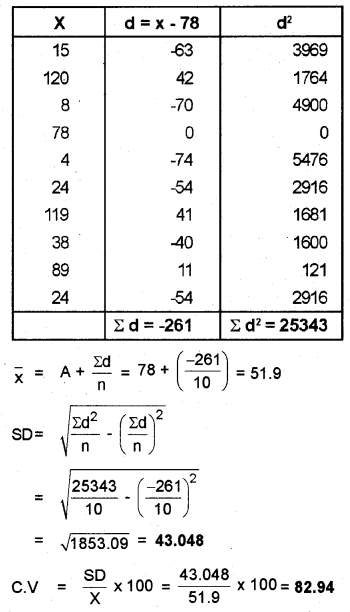
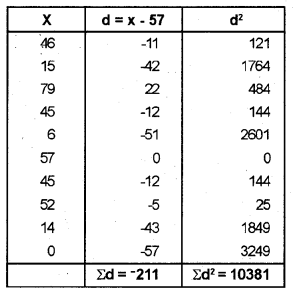
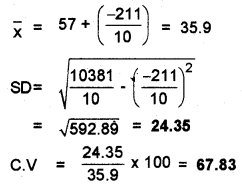
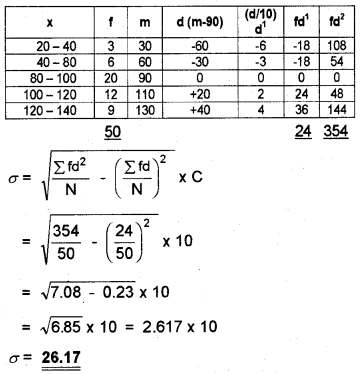
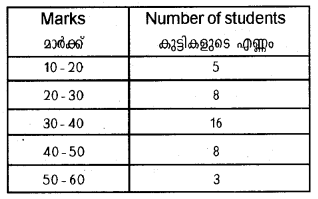
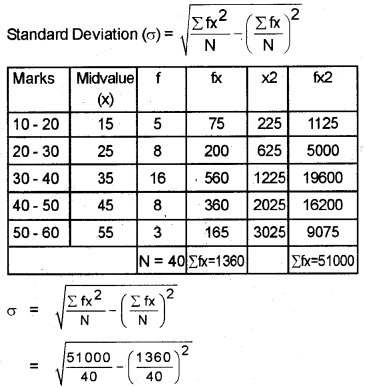
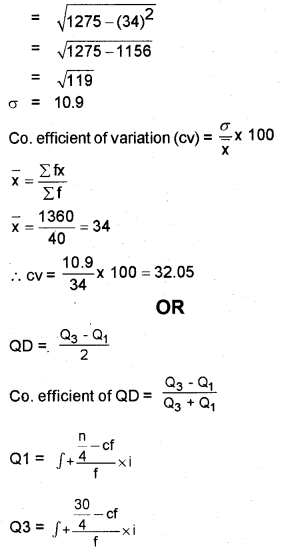
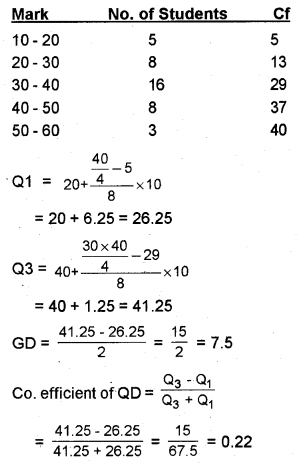
Calculate the standard deviation from the following data: (March 2009)
Answer:
Question 4.
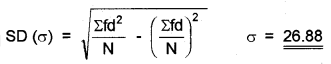
Runs obtained by 2 batsmen in a Cricket Team are given below: (Say 2009)
Answer the following questions.
1) Calculate the arithmetic mean and standard deviation of each of the batsmen.
2) Which batsman should be more reliable in the team?
Answer:
1. Batsman
\(\bar{x}=\frac{\Sigma x}{N}\) = 52.5
SD = 13.64
Batsman 2
\(\bar{x}=\frac{\Sigma x}{N}\) = 57.32
SD = 16.64
2) Batsman 1 is more reliable in the team.
Coefficient of variation = \(\frac{\mathrm{SD}}{\overline{\mathrm{x}}} \times 100\)
C.V. of Batsman 1 = \(\frac{13.64}{52.5} \times 100\) = 26.15%
C.V. of Batsman 2 = \(\frac{16.64}{57.35} \times 100\) = 28.7%
Question 5.
Pick the odd one out and justify your answer. (March 2010)
Range, Median, Quartile deviation, Mean deviation, Standard deviation.
Answer:
Median. Others are measures of dispersion.
Question 6.
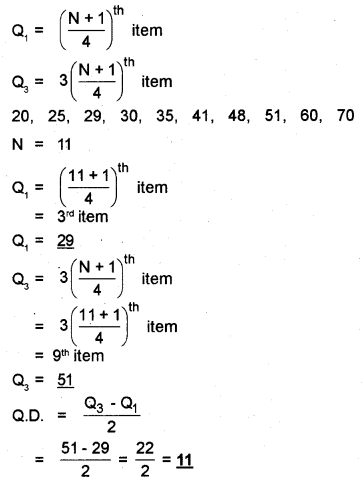
Incomes earned by a businessman for the last eleven years are given below. Calculate the range and quartile deviation. (March 2010)
Income (in lakhs): 8, 20, 18, 32, 60, 27, 44, 28, 31, 26, 12.
Answer:
Range = H – L = 60 – 8 = 52
Question 7.
The following are the marks obtained for the class test of 10 students in a class for Malayalam and Hindi. (March 2011)
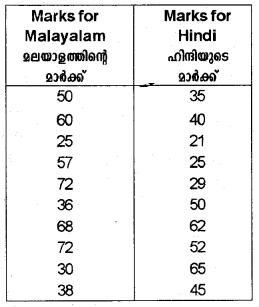
a) Calculate the standard deviation.
b) Compare the performance of students using the answers obtained.
Answer:
Calculate Standard Deviation by using the formula.
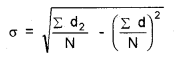
for two sets of data and compare the results.
Question 8.
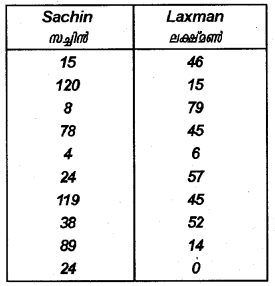
The following are the scores made by two batsmen, Sachin and Laxman in a series of innings. Find which batsman is more consistent. (March 2012)
OR
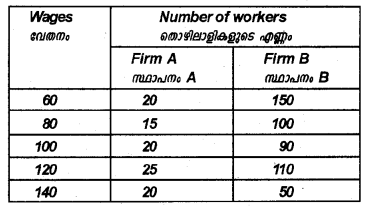
Wages in two firms, X and Y are given in the table. Using the Lorenz curve, show where the inequality in wages is high.
Answer:
Sachin
Laxman
Laxman is more constant than Sachin.
OR
Firm A
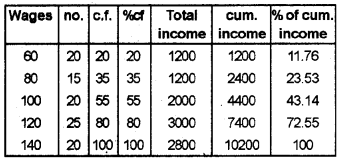
Firm B
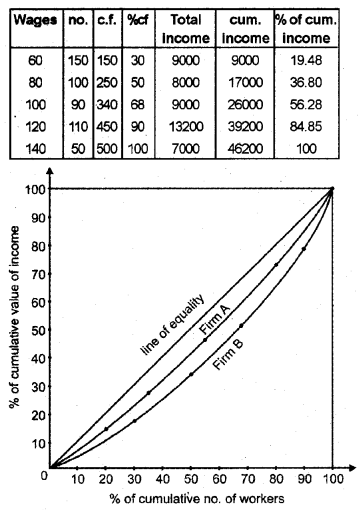
Inequality in wages is high in Firm B.
Question 9.
Vishnu and Joshy are classmates. Usually, they conduct combine studies during holidays. They want to draw a Lorenz curve during the course of their study. Explain the steps required to draw the Lorenz Curve. (Say 2012)
Answer:
In economics, the Lorenz curve is a graphical representation of the cumulative distribution function of the empirical probability distribution of wealth; it is a graph showing the proportion of the distribution assumed by the bottom y% of the values (although this is not rigorously true for a finite population — see below). It is often used to represent income distribution, where it shows for the bottom x% of households, what percentage y% of the total income they have.
The percentage of households is plotted on the x-axis, the percentage of income on the y-axis. It can also be used to show the distribution of assets. In such use, many economists consider it to be a measure of social inequality. It was developed by Max O. Lorenz in 1905 for representing inequality of wealth distribution.
The steps in constructing a Lorenz curve are given below:
- If not already sorted, sort the income distribution by income level.
- Define the proportion of income owned by each individual and his proportion to the total population.
- Define the cumulative proportion of income and the cumulative proportion of the population.
- Define the line of equidistributed income.
- Plot the cumulative proportion of income against the cumulative proportion of the population.
Question 10.
Income earned by a businessman for the last 8 years is given below. Calculate range and quartile deviation. (Say 2012)
![]()
Answer:
Range = L – S
L = largest item = 60
S = smallest item = 8
Range = 60 – 8 = 52
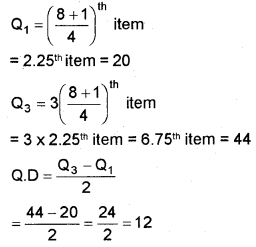
Quartile deviation
Items = 8, 18, 20, 27, 28, 32, 44, 60
Question 11.
Your Economics teacher is planning to form an economic association in your school. She has to select a convener from two students. The criteria for selection is the consistency in marks of five class tests in Economics. The marks are: (March 2013)
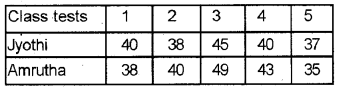
Who will be selected as the convener?
(Hint: State the answer by finding SD and CV).
OR
Prepare a seminar paper on the various absolute and relative measures of dispersion.
Answer:
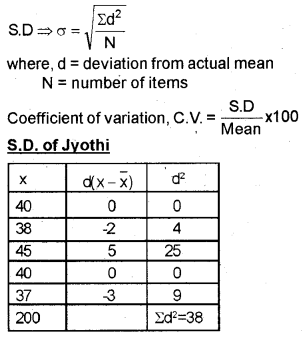
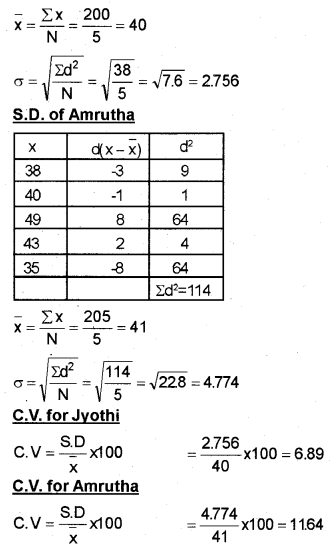
Since S.D and C.V. of Jyothi are less compared to Amrutha, Jyothi is considered as more consistent. Therefore Jyothi should be selected as convenor according to the criteria.
OR
Dispersion
A measure of dispersion can tell you about income inequalities, thereby improving the understanding of the relative standards of living enjoyed by different strata of society. Dispersion is the extent to which values in a distribution differ from the average of the distribution.
To quantify the extent of the variation, there are certain measures namely:
- Range
- Quartile Deviation
- Mean Deviation
- Standard Deviation
- Lorenz Curve
Range
Range (R) is the difference between the largest (L) and the smallest value (S) in a distribution.
Thus, R = L – S
A higher value of Range implies higher dispersion and vice-versa.
Quartile Deviation
The presence of even one extremely high or low value in distribution can reduce the utility of range as a measure of dispersion. Thus, you may need a measure which is not unduly affected by the outliers. In such a situation, if the entire data is divided into four equal parts, each containing 25% of the values, we get the values of Quartiles and Median. The upper and lower quartiles (Q3 and Q1 respectively) are used to calculate Inter Quartile Range which is Q3 – Q1.
Mean Deviation
Mean deviation of a series is the arithmetic average of the deviations of various items from a measure of central tendency. In aggregating the deviations, algebraic signs of the deviations are not taken into account. It is because, if the algebraic signs were taken into account, the sum of deviations from the mean should be zero and that from the median is nearly zero. Theoretically, the deviations can be taken from any of the three averages, namely, arithmetic mean, median, or mode; but, the mode is usually not considered as it is less stable. Between mean and median, the latter is supposed to be better because the sum of the deviations from the median is less than the sum of the deviations from the mean,
Co-efficient of MD = \(\frac{\mathrm{MD}}{\text { Average }}\)
Standard Deviation
Standard deviation is defined as the square root of the arithmetic average of the squares of deviations taken from the arithmetic average of a series. It is also known as the root-mean-square deviation for the reason that it is the square root of the mean of the squared deviations from AM.
Standard deviation is denoted by the Greek letter a (small letter ‘sigma’). The term variance is used to describe the square of the standard deviation. Standard deviation is an absolute measure of dispersion. The corresponding relative measure is called the coefficient of SD. The coefficient of variation is also a relative measure. A series with more coefficient of variation is regarded as less consistent or less stable than a series with less coefficient of variation.
Symbolically, Standard deviation = σ
Variance = σ2
Coefficient of SD = \(\frac{\sigma}{\bar{x}}\)
Coefficient of variation = \(\frac{\sigma}{\bar{x}} \times 100\)
Lorenz Curve
The measures of dispersion discussed so far give a numerical value of dispersion. A graphical measure called the Lorenz Curve is available for estimating dispersion.
Lorenz Curve uses the information expressed in a cumulative manner to indicate the degree of variability. It is especially useful in comparing the variability of two or more distributions.
Construction of the Lorenz Curve
Following steps are required for the Construction of the Lorenz Curve
- Calculate class mid-points and find cumulative totals
- Calculate cumulative frequencies
- Express the grand totals and convert the cumulative totals into percentages,
- Now, on the graph paper, take the cumulative percentages of the variable (incomes) on the Y-axis and cumulative percentages of frequencies (number of employees) on the X-axis.
- Draw a line joining Co-ordinate (0, 0) with (100, 100). This is called the line of equal distribution.
- Plot the cumulative percentages of the variable with corresponding cumulative percentages of frequency. Join these points to get the curve.
Question 12.
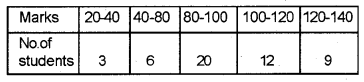
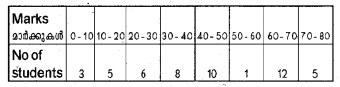
Calculate range and co-efficient of range of the following series. (Say 2013)
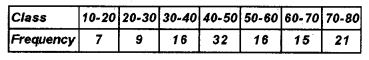
Answer:
In continuous series range is the difference between a lower limit of the lowest class and the upper limit of the highest class.
Here range is 80 – 10 = 70
Co-efficient of Range = \(\frac{80-10}{80+10}=\frac{70}{90}\) = 77.77
Question 13.
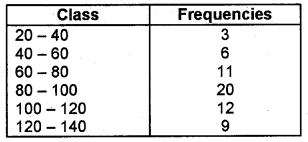
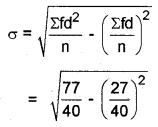
The daily wage earned by 40 workers is given below. Calculate Standard Deviation. (Say 2013)
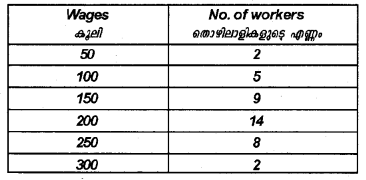
Answer:
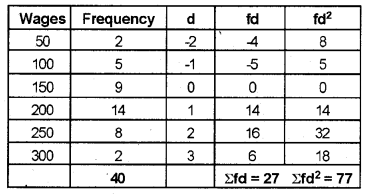
The assumed mean is 150, and take deviations from assumed means
Question 14.
The following data shows the daily wages of 11 families: (March 2014)
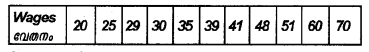
Compute the range and quartile deviation.
Answer:
Range = L – S
Whereas
L = Longest value
S = Smallest value
Here
L = 70
S = 20
R = 70 – 20
Range = 50
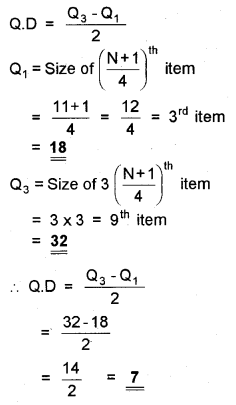
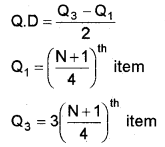
Quartile deviation Q.D. = \(\frac{Q_{3}-Q_{1}}{2}\)
Step one – arrange the data in ascending order
Question 15.
The positive square root of the mean of squared deviations from the mean. (March 2014)
Answer:
Standard Deviation
Question 16.
Fill in the blanks with the correct terms related to standard deviation. (Say 2014)
a) Standard deviation : Absolute dispersion
b) _______ : Relative dispersion
Answer:
Coefficient of variation
Question 17.
John found the value of the upper quartile (Q3) of the following distribution like 8. (Say 2014)
14, 5, 8, 1, 3, 5, 4, 9, 8, 2, 20
Correct it, if it is wrong.
Answer:
The answer is wrong. The correct answer is 9
Question 18.
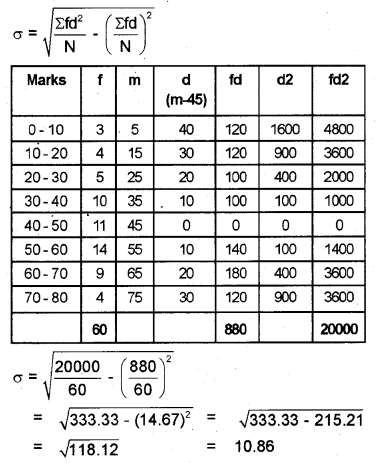
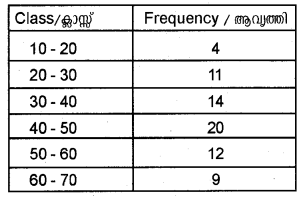
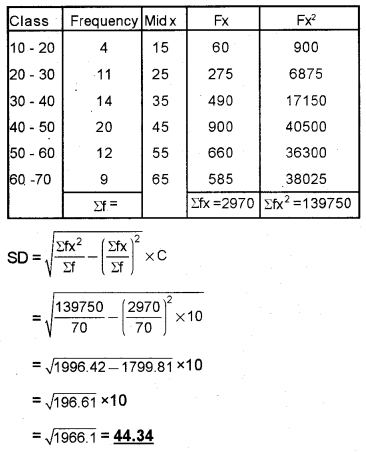
Marks secured by 60 students in your class for Economics in the second term examination are: (Say 2014)
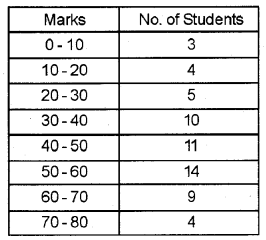
Calculate the standard deviation.
Answer:
Standard deviation
Question 19.
Calculate the standard deviation and coefficient of standard deviation for the following distribution. (March 2015)
Answer:
Standard deviation
Question 20.
Calculate the range and quartile deviation for the following distribution. (March 2015)
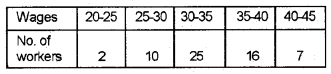
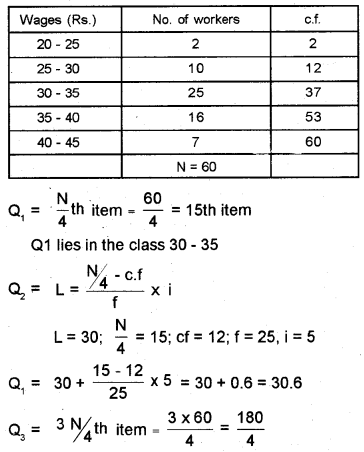
Answer:
Range
Range = L – S = 45 – 20 = 25
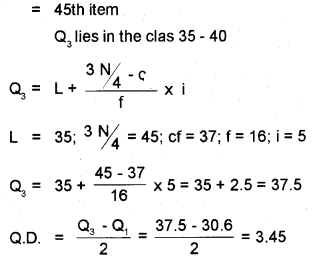
Quartile deviation
Question 21.
Find standard deviation and coefficient of variation for the following data: (Say 2015)
OR
Find the quartile deviation of the above data. Also, find the coefficient of quartile deviation.
Answer:
Question 22.
The following are the marks obtained for the class test of 10 students in a class for Economics and History. (March 2016)
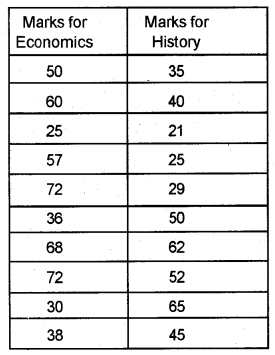
a) Calculate the standard deviation.
b) Compare the performance of students.
Answer:
a) S.D for economics: 16.73
S.D. for History: 14.32
Coefficient of variation for economics: 32.93
Coefficient of variation for History: 33.77
b) Assessment
The performance of economics students is best.
Question 23.
Calculate the standard deviation for the following distribution. (Say 2016)
Answer:
Standard deviation
Question 24.
a) Name the relative measure of standard deviation. (March 2017)
b) Define SD.
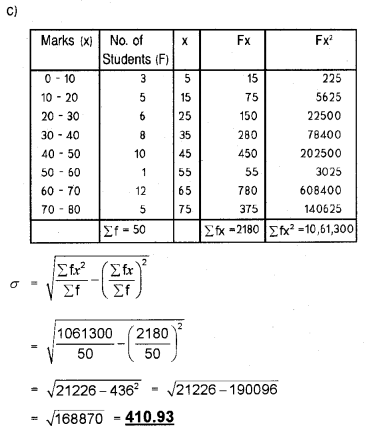
c) Calculate the standard deviation from the following data:
Answer:
a) Coefficient of variance
CV = \(\frac{\mathrm{SD}}{\mathrm{mean}} \times 100\)
b) Standard deviation is the positive square root of the mean of square deviations from the mean. It is denoted by the sign ‘σ’.