NCERT Solutions for Class 9 Maths Chapter 15 Probability, are part of NCERT Solutions for Class 9 Maths. Here we have given NCERT Solutions for Class 9 Maths Chapter 15 Probability.
NCERT Solutions for Class 9 Maths Chapter 15 Probability Ex 15.1
Question 1.
In a cricket match, a batswoman hits a boundary 6 times out of 30 balls she plays. Find the probability that she did not hit a boundary.
Solution:
Since, batswoman plays 30 balls, therefore total number of trials is n(S) = 30.
Let E be the event of hitting the boundary.
∴ n(E) = 6
The number of balls not hitting the target
n(E’) = 30-6=24
The probability that she does not hit a boundary = \(\frac { n(E’) }{ n(S) }\) = \(\frac { 24 }{ n(30) }\) = \(\frac { 4 }{ 5 }\)
Question 2.
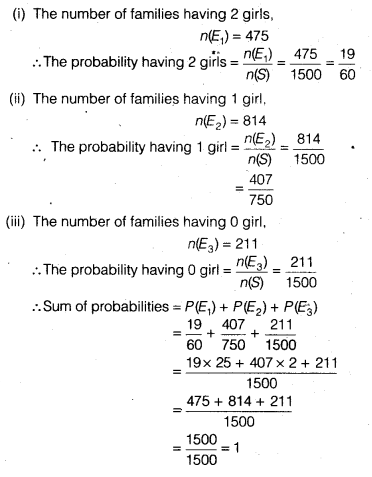
1500 families with 2 children were selected randomly, and the following data were recorded
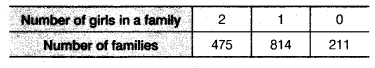
Compute the probability of a family, chosen at random, having
(i) 2 girls (ii) 1 girl (iii) no girl
Also, check whether the sum of these probabilities is 1.
Solution:
Question 3.
In a particular section of class IX, 40 students were asked about the month of their birth and the following graph was prepared for the data so obtained.
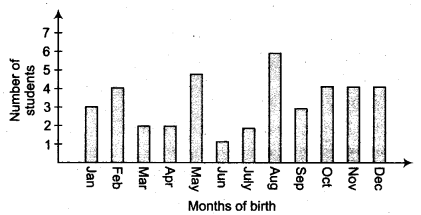
Find the probability that a student of the class was born in August.
Solution:
Total number of students in class IX, n(S) = 40
Number of students born in the month of August, n(E) = 6
Probability, that the students of the class was born in August = \(\frac { n(E) }{ n(S) }\) = \(\frac { 6 }{ 40 }\) = \(\frac { 3 }{ 20 }\)
Question 4.
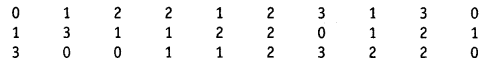
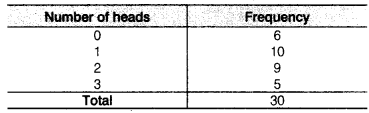
Three coins are tossed simultaneously 200 times with the following frequencies of different outcomes.
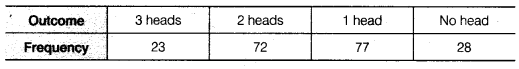
If the three coins are simultaneously tossed again, compute the probability of 2 heads coming up.
Solution:
In tossing of three coins, getting two heads comes out 72 times,
i.e., n(E) = 72
The total number of tossed three coins n(S) = 200
∴ Probability of 2 heads coming up = \(\frac { n(E) }{ n(S) }\) = \(\frac { 72 }{ 200 }\) = \(\frac { 9 }{ 25 }\)
Question 5.
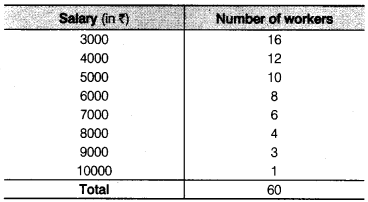
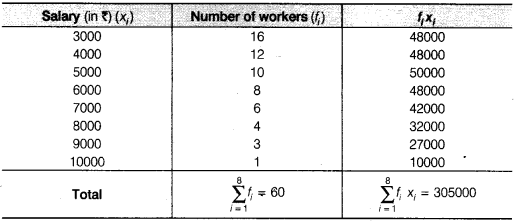
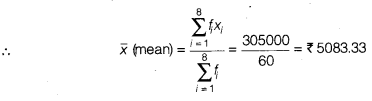
An organisation selected 2400 families at random and surveyed them to determine a relationship between income level and the number of vehicles in a family. The information gathered is listed in the table below.
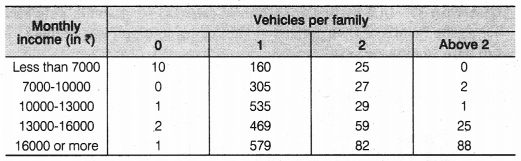
Suppose a family is chosen. Find the probability that the family chosen is
(i) earning ₹ 10000-13000 per month and owning exactly 2 vehicles.
(ii) earning ₹16000 or more per month and owning exactly 1 vehicle.
(iii) earning less than ₹ 7000 per month and does not own any vehicle.
(iv) earning ₹13000-16000 per month and owning more than 2 vehicles.
(v) owning not more than 1 vehicle.
Solution:
Total number of families selected by the organisation, n(S) = 2400
(i) The number of families earning ₹ 10000-13000 per month and owing exactly 2 vehicles, n(E1) = 29
![]()
(ii) The number of families earning ₹ 16000 or more per month and owing exactly 1 vehicle, n(E2) = 579
![]()
(iii) The number of families earning less than ₹ 7000 per month and does not own any vehicle, n(E3) = 10
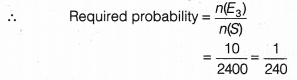
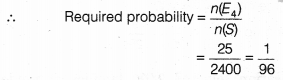
(iv) The number of families earning ₹ 13000-16000 per month and owing more than 2 vehicles, n(E4) = 25

(v) The number of families owing not more than 1 vehicle,
n(E5) = (10 + 1 + 2 + 1) + (160 + 305 + 535 + 469 + 579)
=14 + 2048 = 2062
Question 6.
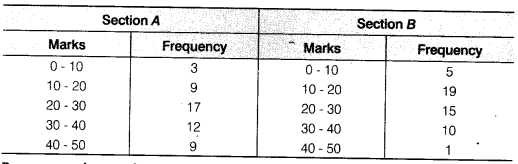
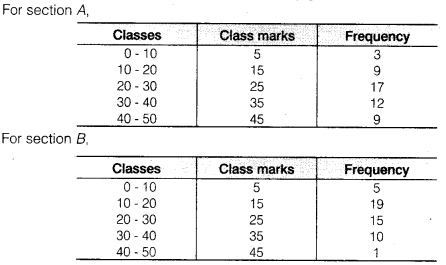
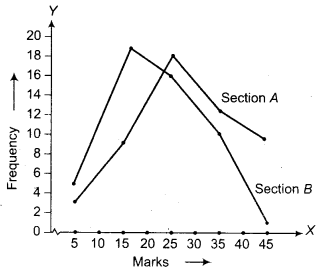
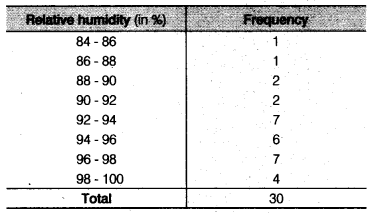
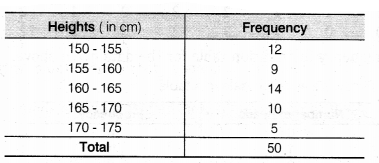
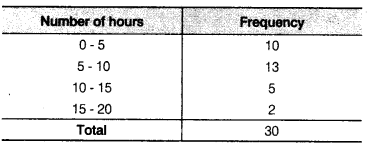
A teacher wanted to analyse the performance of two sections of students in a mathematics test of 100 marks. Looking at their performances, she found that a few students got under 20 marks and a few got 70 marks or above. So she decided to group them into intervals of varying sizes as follows
0-20, 20 – 30, …, 60 – 70, 70 – 100. Then she formed the following table
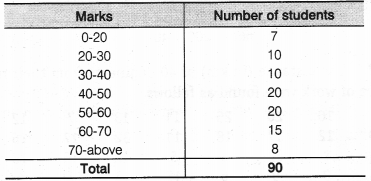
(i) Find the probability that a student obtained less than 20% in the mathematics test.
(ii) Find the probability that a student obtained marks 60 or above.
Solution:
(i) Total number of students in a class. n(S) = 90
The number of students less than 20% lies in the interval 0-20,
i.e., n(E) = 7
∴ The probability, that a student obtained less than 20% in the Mathematics test = \(\frac { n(E) }{ n(S) }\) = \(\frac { 7 }{ 90 }\)
(ii) The number of students obtained marks 60 or above lies in the marks interval 60-70 and 70-above
i.e., n(F) = 15+ 8 = 23
∴ The probability that a student obtained marks 60 or above = \(\frac { n(E) }{ n(S) }\) = \(\frac { 23 }{ 90 }\)
Question 7.
To know the opinion of the students about the subject statistics, a survey of 200 students was conducted. The data is recorded in the following table
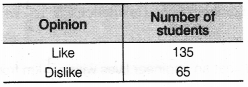
Find the probability that a student chosen at random
(i) likes statistics,
(ii) does not like it.
Solution:
Total number of students, n(S) = 200
(i) The number of students who like Statistics, n(E) = 135
![]()
(ii) The number of students who does not like Statistics, n(F) = 65
∴ The probability, that the student does not like Statistics
![]()
Question 8.
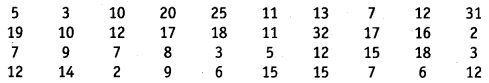
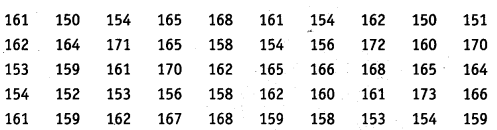
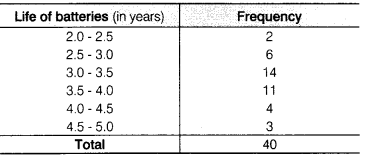
The distance (in km) of 40 engineers from their residence to their place of work were found as follows
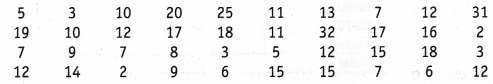
What is the empirical probability that an engineer lives
(i) less than 7 km from her place of work?
(ii) more than or equal to 7 km from her place of work?
(iii) within \(\frac { 1 }{ 2 }\) km from her place of work?
Solution:
Total number of engineers lives, n(S) = 40
(i) The number of engineers whose residence is less than 7 km from their place, n(E) = 9
∴ The probability, that an engineer lives less than 7 km from their place of work
![]()
(ii) The number of engineers whose residence is more than or equal to 7 km from their place of work, n(F) = 40 – 9 = 31
∴The probability, that an engineer lives more than or equal to 7 km from their place of work = \(\frac { n(F) }{ n(S) }\) = \(\frac { 31 }{ 40 }\)
(iii) The number of engineers whose residence within \(\frac { 1 }{ 2 }\) km from their place of work, i.e., n(G) = 0
∴ The probability, that an engineer lives within \(\frac { 1 }{ 2 }\) km from their place
= \(\frac { n(G) }{ n(S) }\) = \(\frac { 0 }{ 40 }\) = 0
Question 9.
Activity: Note the frequency of two-wheelers, three-wheelers and four-wheelers going past during a time interval, in front of your school gate. Find the probability that any one vehicle out of the total vehicles you have observed is a two-wheeler?
Solution:
After observing in front of the school gate in time interval 6:30 to 7:30 am respective frequencies of different types of vehicles are .
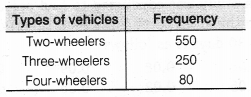
∴ Total number of vehicle, n(S) = 550 + 250 + 80 = 880
Number of two-wheelers, n(E) = 550
∴ Probability of observing two-wheelers = \(\frac { n(E) }{ n(S) }\) = \(\frac { 550 }{ 880 }\) = \(\frac { 5 }{ 8 }\)
Question 10.
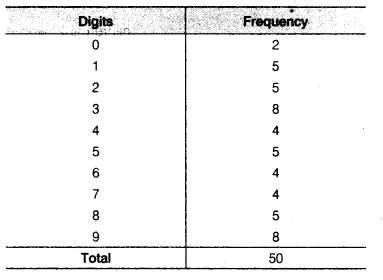
Activity : Ask all the students in your class to write a 3-digit number. Choose any student from the room at random. What is the probability that the number written by her/him is divisible by 3? Remember that a number is divisible by 3, if the sum of its digit is divisible by 3.
Solution:
Suppose, there are 40 students in a class.
∴ The probability of selecting any of the student = \(\frac { 40 }{ 40 }\) = 1
A three digit number start from 100 to 999
Total number of three digit numbers = 999 – 99 = 900
∴ Multiple of 3 in three digit numbers = {102,105 ….., 999}
∴ Number of multiples of 3 in three digit number = \(\frac { 900 }{ 3 }\) = 300
i.e., n(E) = 300
∴ The probability that the number written by her/him,is divisible by 3
= \(\frac { n(E) }{ n(S) }\) = \(\frac { 300 }{ 900 }\) = \(\frac { 1 }{ 3 }\)
Question 11.
Eleven bags of wheat flour, each marked 5 kg, actually contained the following weights of flour (in kg)
4.97, 5.05, 5.08, 5.03, 5.00, 5.06, 5.08, 4.98, 5.04, 5.07, 5.00
Find the probability that any of these bags,chosen at random contains more than 5 kg of flour.
Solution:
The total number of wheat flour bags; n(S) = 11
Bags, which contains more than 5 kg of flour, (E)
= {5,05, 5.08, 5.03, 5.06, 5.08, 5.04, 5.07}
∴ n(E) = 7
∴ Required probability =\(\frac { n(E) }{ n(S) }\) = \(\frac { 7 }{ 11 }\)
Question 12.
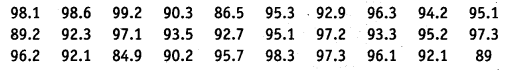
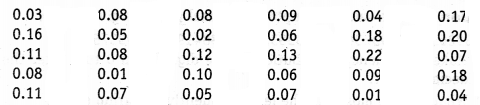
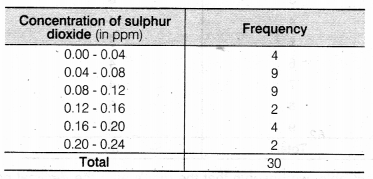
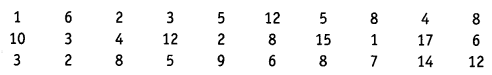
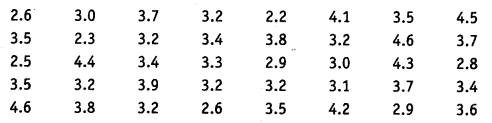
A study was conducted to find out the concentration of sulphur dioxide in the air in parts per million (ppm) of a certain city. The data obtained for 30 days is as follows
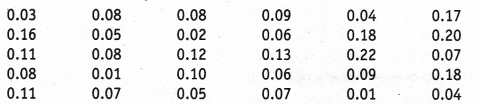
You were asked to prepare a frequency distribution table, regarding the concentration of sulphur dioxide in the air in parts per million of a certain city for 30 days. Using this table, find the probability of the concentration of sulphur dioxide in the interval 0.12-0.16 on any of these days.
Solution:
Now, we prepare a frequency distribution table
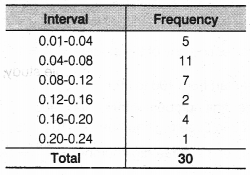
The total number of days for data, to prepare sulphur dioxide, n(S) = 30
The frequency of the sulphur dioxide in the interval 0.12-0.16, n(E) = 2
![]()
Question 13.
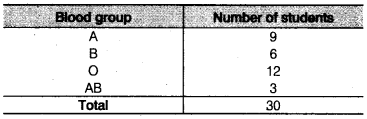
The blood groups of 30 students of class VIII are recorded as follows
A, B, 0, 0, AB, 0, A, 0, B, A, 0, B, A, 0, 0, A, AB, 0, A, A, 0, 0, AB, B, A, B, 0
You were asked to prepare a frequency distribution table regarding the blood groups of 30 students of a class. Use this table to determine the probability that a student of this class, selected at random, has blood group AB.
Solution:
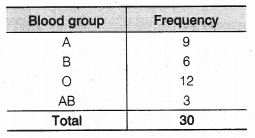
The total number of students in class VIII, n(S) = 30
The number of students who have blood group AB, n(E) = 3
∴ The probability that a student has a blood group AB =\(\frac { n(E) }{ n(S) }\) = \(\frac {3 }{ 30 }\) = \(\frac { 1 }{ 10 }\)
We hope the NCERT Solutions for Class 9 Maths Chapter 15 Probability, help you. If you have any query regarding NCERT Solutions for Class 9 Maths Chapter 15 Probability, drop a comment below and we will get back to you at the earliest.