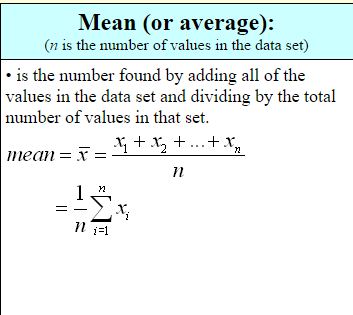
Selina Concise Mathematics Class 10 ICSE Solutions Measures of Central Tendency (Mean, Median, Quartiles and Mode)
Selina Publishers Concise Mathematics Class 10 ICSE Solutions Chapter 24 Measures of Central Tendency
Measures of Central Tendency Exercise 24A – Selina Concise Mathematics Class 10 ICSE Solutions
Question 1.
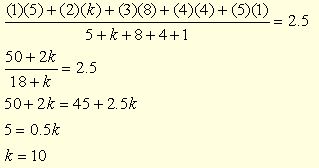
Find the mean of the following set of numbers:
(i) 6, 9, 11, 12 and 7
(ii) 11, 14, 23, 26, 10, 12, 18 and 6
Solution:
Question 2.
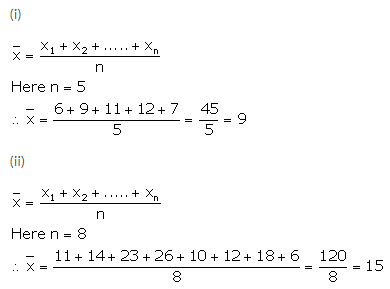
Marks obtained (in mathematics) by 9 student are given below:
60, 67, 52, 76, 50, 51, 74, 45 and 56
(a) find the arithmetic mean
(b) if marks of each student be increased by 4; what will be the new value of arithmetic mean.
Solution:
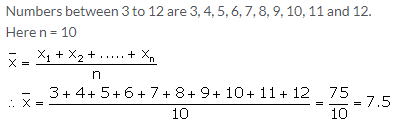
Question 3.
Find the mean of the natural numbers from 3 to 12.
Solution:
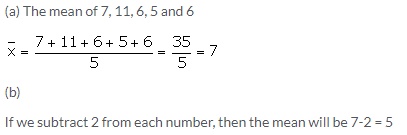
Question 4.
(a) Find the mean of 7, 11, 6, 5, and 6
(b) If each number given in (a) is diminished by 2, find the new value of mean.
Solution:
Question 5.
If the mean of 6, 4, 7, ‘a’ and 10 is 8. Find the value of ‘a’
Solution:
No. of terms = 5
Mean = 8
Sum of numbers = 8 x 5 = 40 .(i)
But, sum of numbers = 6+4+7+a+10 = 27+a ..(ii)
From (i) and (ii)
27+a = 40
a = 13
Question 6.
The mean of the number 6, ‘y’, 7, ‘x’ and 14 is 8. Express ‘y’ in terms of ‘x’.
Solution:
No. of terms = 5 and mean = 8
Sum of numbers = 5 x 8 = 40 ..(i)
but sum of numbers = 6+y+7+x+14 = 27+y+x .(ii)
from (i) and (ii)
27 + y + x = 40
x + y = 13
y = 13 – x
Question 7.
Solution:
Question 8.
If 69.5 is the mean of 72, 70, ‘x’, 62, 50, 71, 90, 64, 58 and 82, find the value of ‘x’.
Solution:
No. of terms = 10
Mean = 69.5
Sum of the numbers = 69.5 x 10 = 695 ……….(i)
But sum of numbers = 72+70+x+62+ 50+71+90+64+58+82
= 619 + x ……(ii)
from (i) and (ii)
619 + x = 695
x = 76
Question 9.
Solution:
Question 10.
Solution:
Question 11.
Solution:
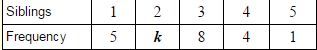
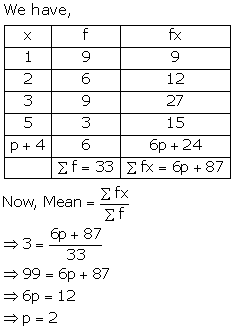
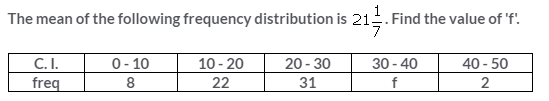
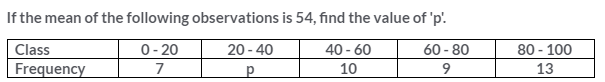
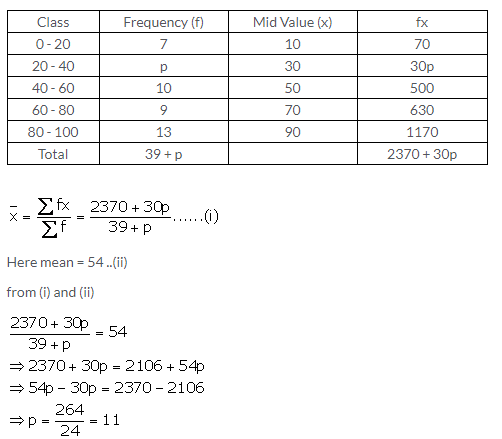
Question 12.
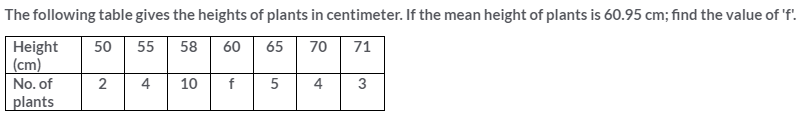
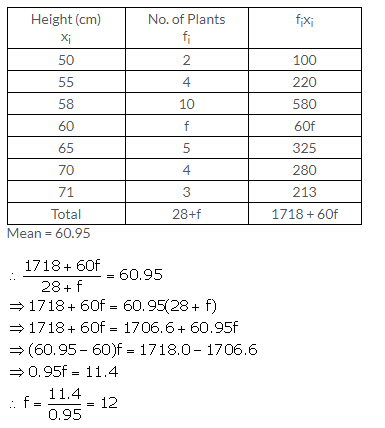
If the mean of the following distribution is 3, find the value of p.
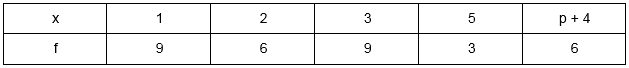
Solution:
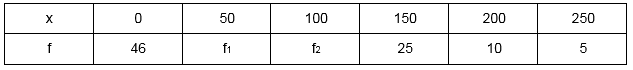
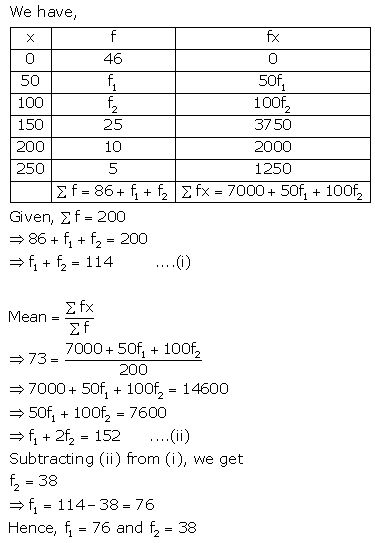
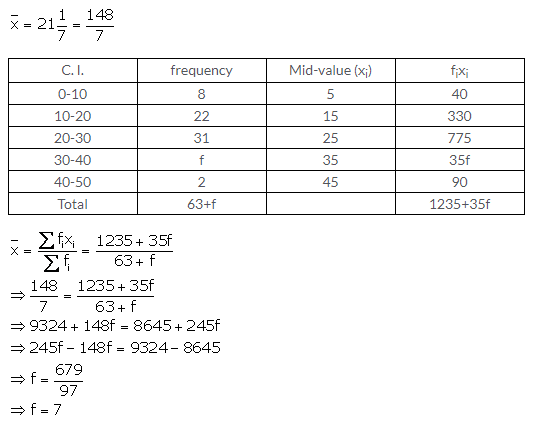
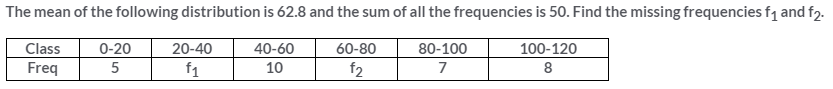
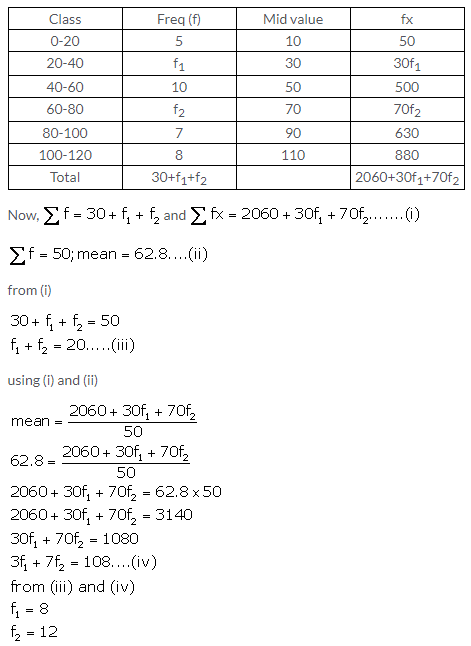
Question 13.
In the following table, ∑f = 200 and mean = 73. Find the missing frequencies f1, and f2.
Solution:
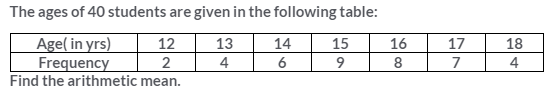
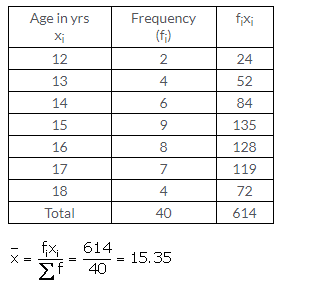
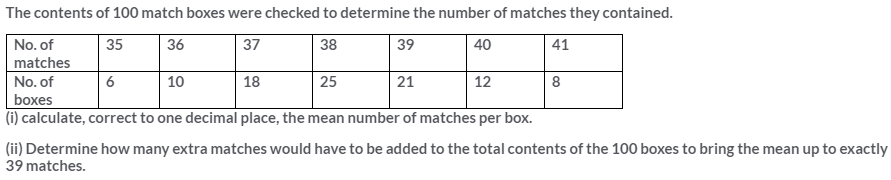
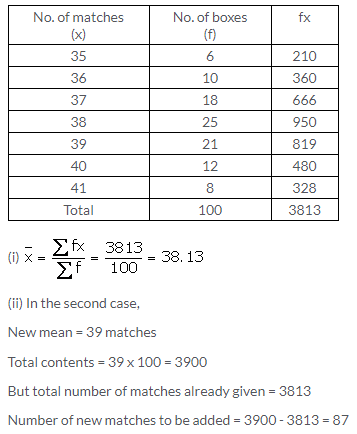
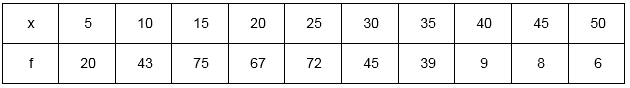
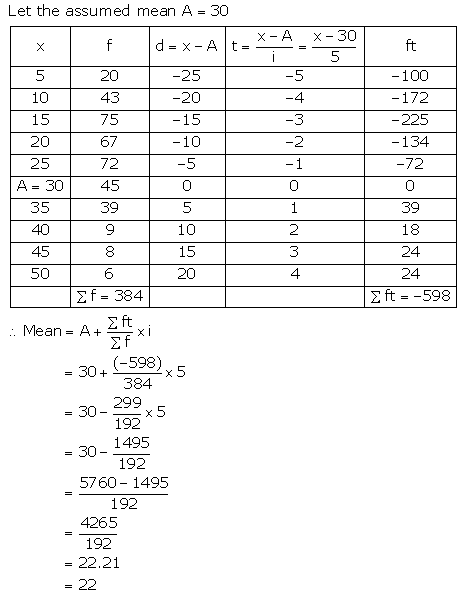
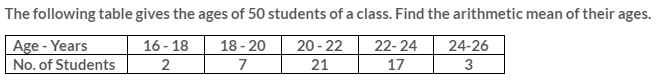
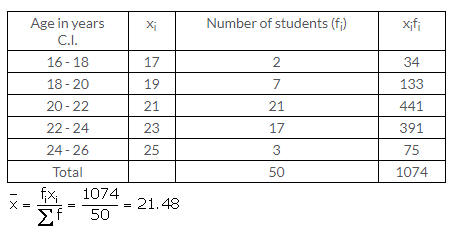
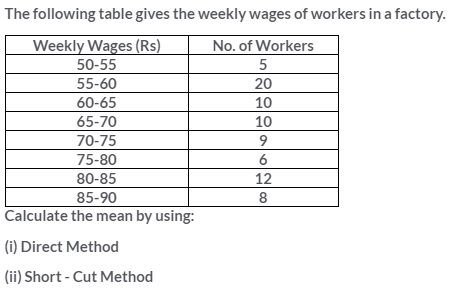
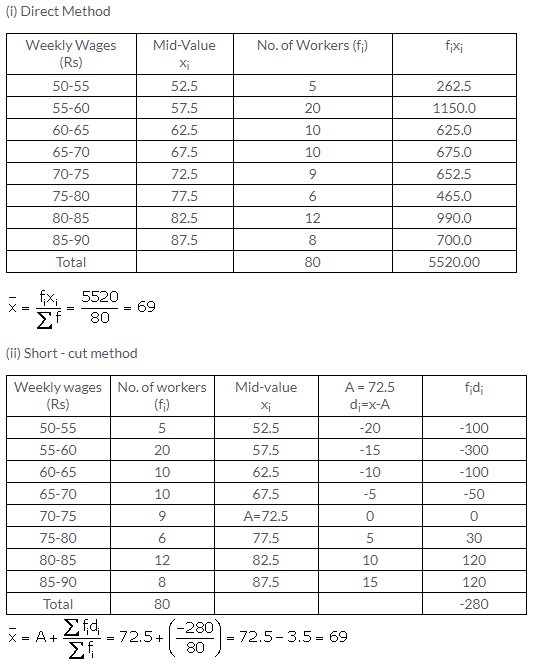
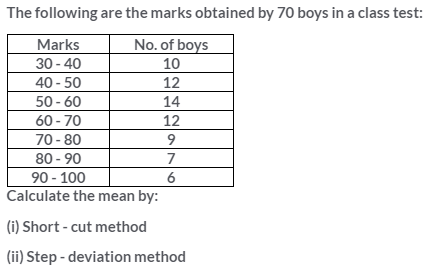
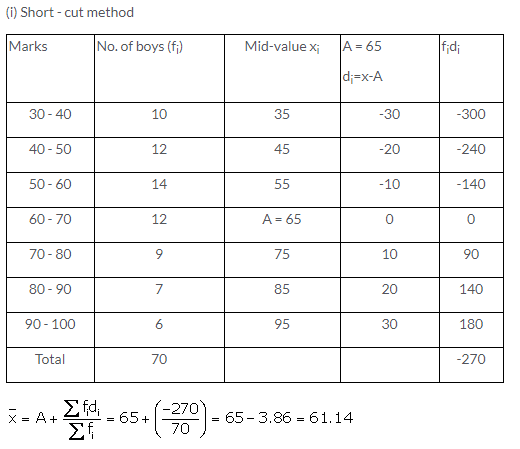
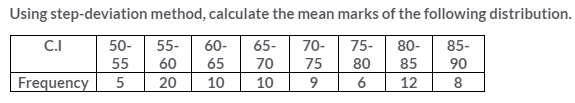
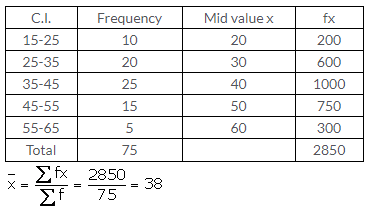
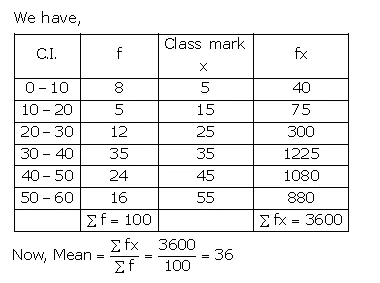
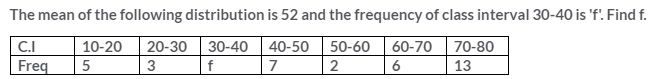
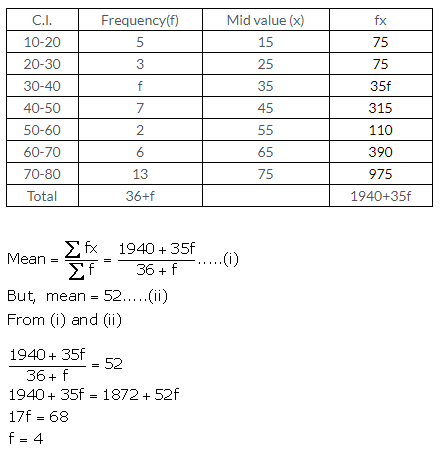
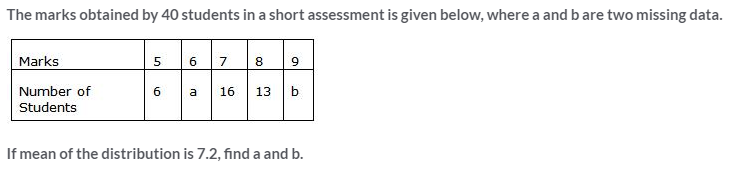
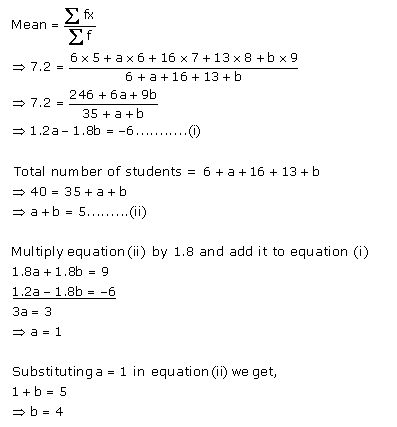
Question 14.
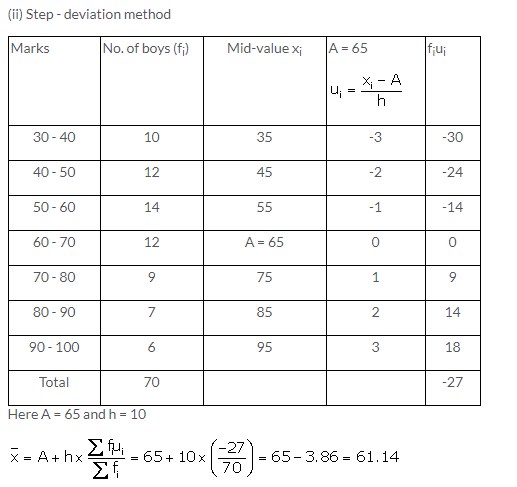
Find the arithmetic mean (correct to the nearest whole-number) by using step-deviation method.
Solution:
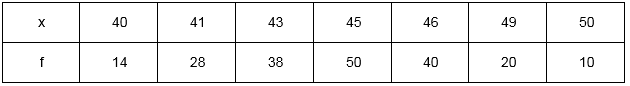
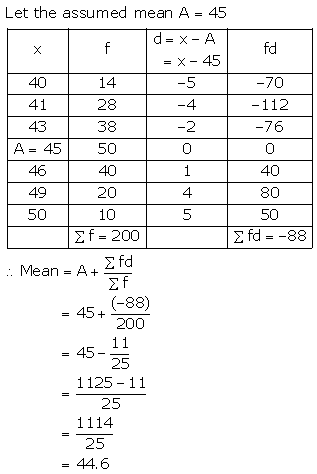
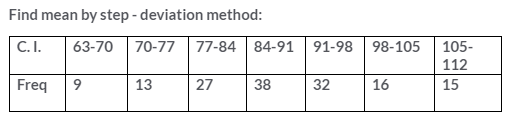
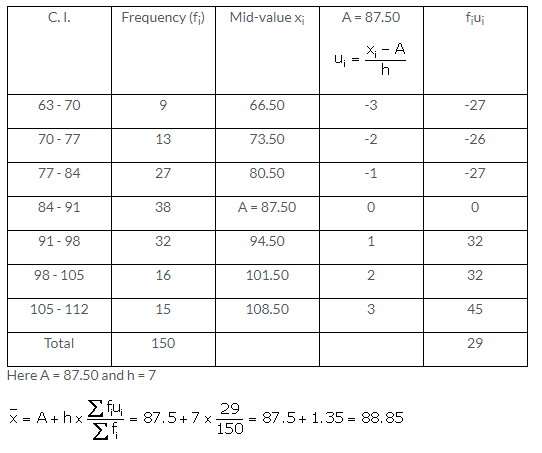
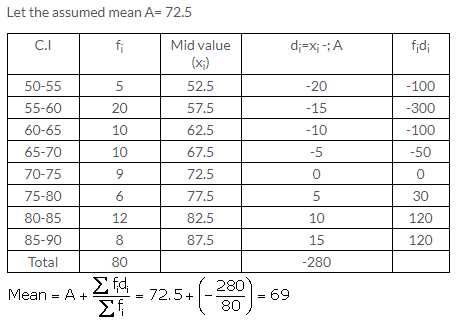
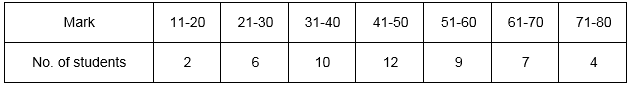
Question 15.
Find the mean (correct to one place of decimal) by using short-cut method.
Solution:
Measures of Central Tendency Exercise 24B – Selina Concise Mathematics Class 10 ICSE Solutions
Question 1.
Solution:
Question 2.
Solution:
Question 3.
Solution:
Question 4.
Solution:
Question 5.
Solution:
Question 6.
Solution:
Question 7.
Solution:
Question 8.
Solution:
Question 9.
Solution:
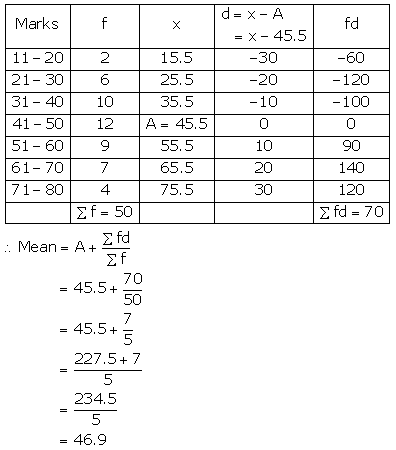
Question 10.
Calculate the mean of the distribution, given below, using the short cut method :
Solution:
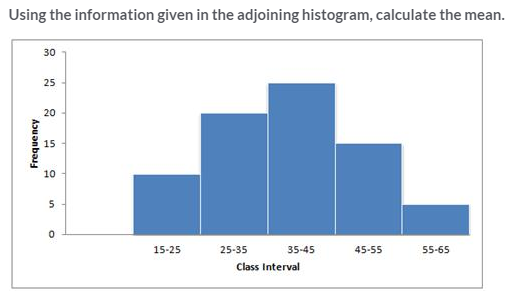
Question 11.
Calculate the mean of the following distribution:
Solution:
Measures of Central Tendency Exercise 24C – Selina Concise Mathematics Class 10 ICSE Solutions
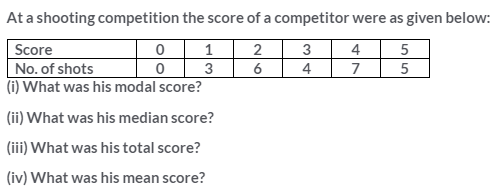
Question 1.
A student got the following marks in 9 questions of a question paper.
3, 5, 7, 3, 8, 0, 1, 4 and 6.
Find the median of these marks.
Solution:
Arranging the given data in descending order:
8, 7, 6, 5, 4, 3, 3, 1, 0
The middle term is 4 which is the 5th term.
Median = 4
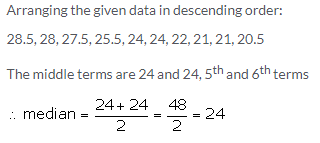
Question 2.
The weights (in kg) of 10 students of a class are given below:
21, 28.5, 20.5, 24, 25.5, 22, 27.5, 28, 21 and 24.
Find the median of their weights.
Solution:
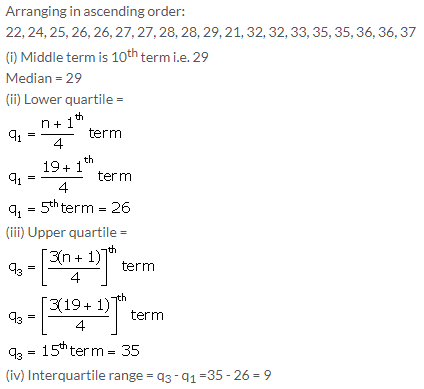
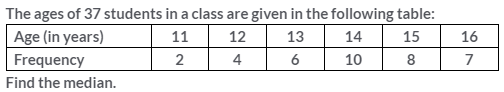
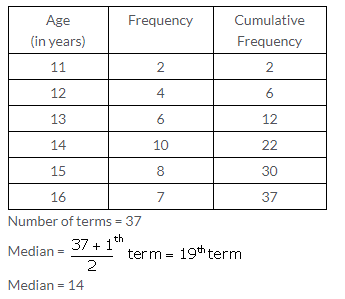
Question 3.
The marks obtained by 19 students of a class are given below:
27, 36, 22, 31, 25, 26, 33, 24, 37, 32, 29, 28, 36, 35, 27, 26, 32, 35 and 28. Find:
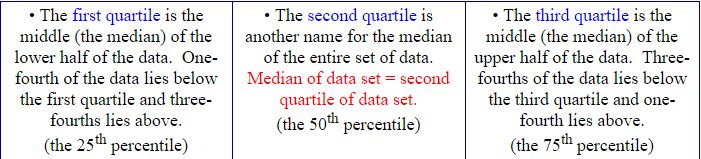
(i) median
(ii) lower quartile
(iii) upper quartile
(iv) interquartile range
Solution:
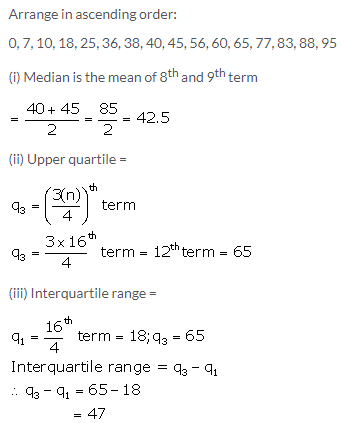
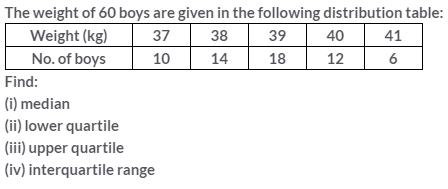
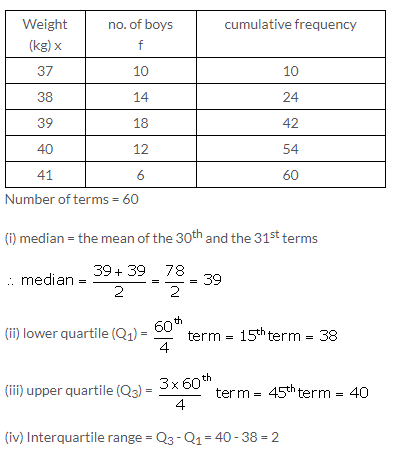
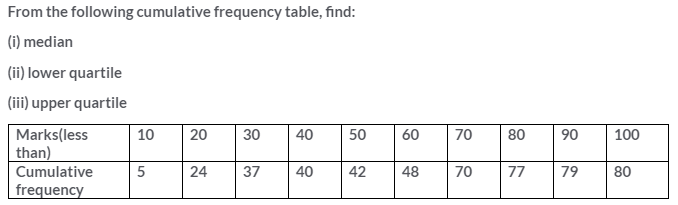
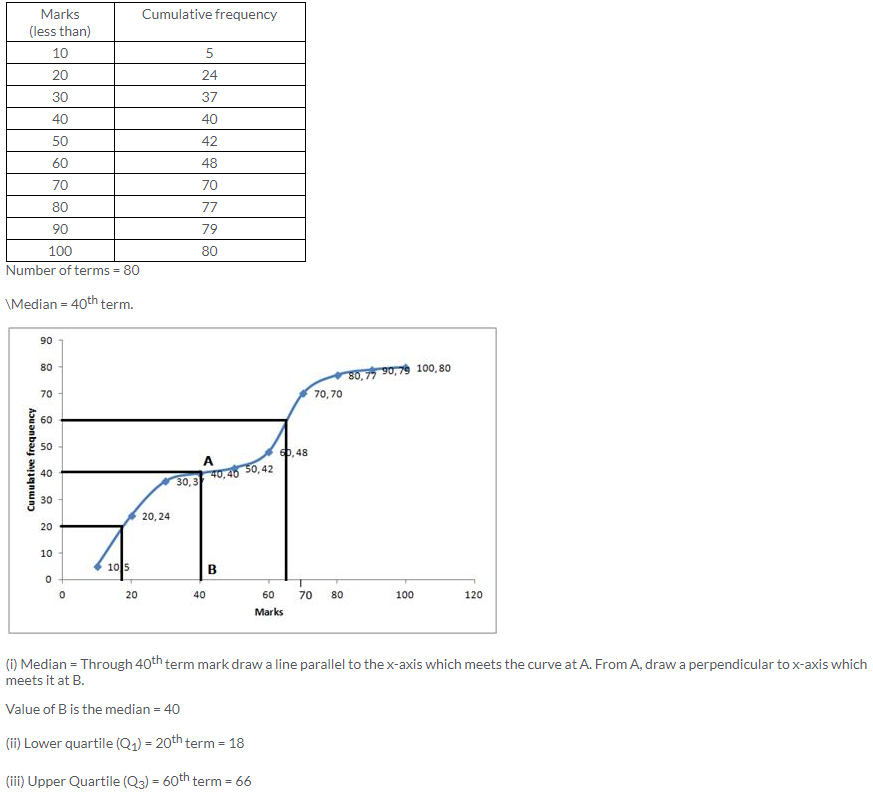
Question 4.
From the following data, find:
(i) Median
(ii) Upper quartile
(iii) Inter-quartile range
25, 10, 40, 88, 45, 60, 77, 36, 18, 95, 56, 65, 7, 0, 38 and 83
Solution:
Question 5.
Solution:
Question 6.
Solution:
Question 7.
Solution:
Question 8.
Solution:
Question 9.
Solution:
Question 10.
Solution:
Question 11.
Solution:
Question 12.
Solution:
Measures of Central Tendency Exercise 24D – Selina Concise Mathematics Class 10 ICSE Solutions
Question 1.
Find the mode of the following data:
(i) 7, 9, 8, 7, 7, 6, 8, 10, 7 and 6
(ii) 9, 11, 8, 11, 16, 9, 11, 5, 3, 11, 17 and 8
Solution:
(i) Mode = 7
Since 7 occurs 4 times
(ii) Mode = 11
Since it occurs 4 times
Question 2.
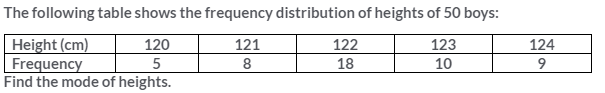
Solution:
Mode is 122 cm because it occur maximum number of times. i.e. frequency is 18.
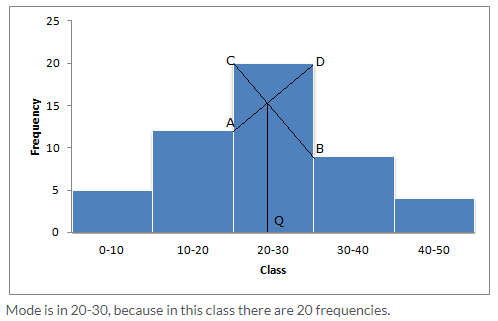
Question 3.
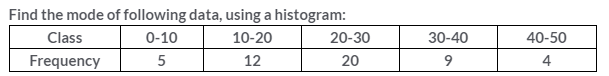
Solution:
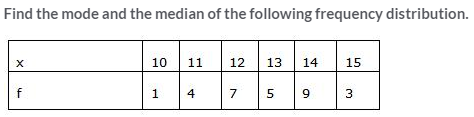
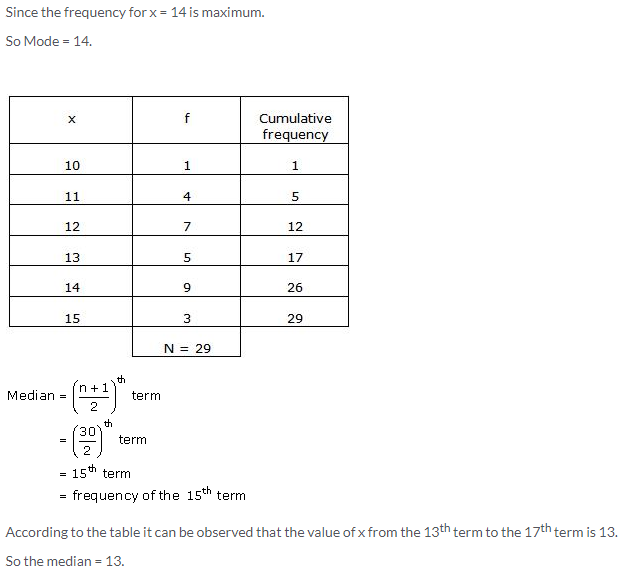
Question 4.
Solution:
Question 5.
Find the median and mode for the set of numbers:
2, 2, 3, 5, 5, 5, 6, 8 and 9
Solution:
Question 6.
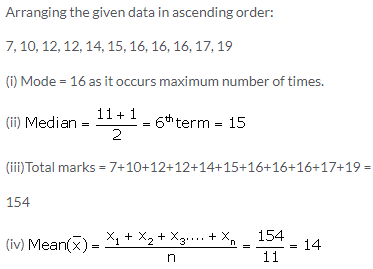
A boy scored following marks in various class tests during a term; each test being marked out of 20.
15, 17, 16, 7, 10, 12, 14, 16, 19, 12 and 16
(i) What are his modal marks?
(ii) What are his median marks?
(iii) What are his total marks?
(iv) What are his mean marks?
Solution:
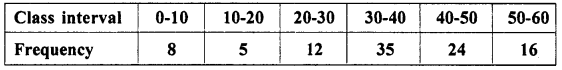
Question 7.
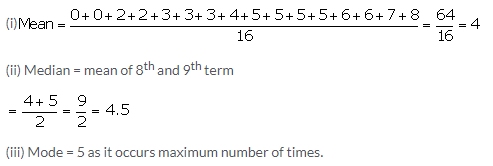
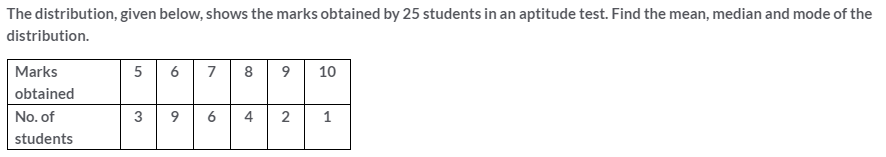
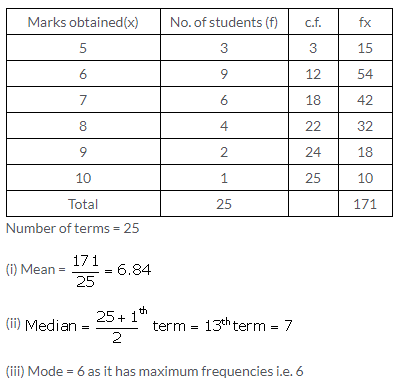
Find the mean, median and mode of the following marks obtained by 16 students in a class test marked out of 10 marks.
0, 0, 2, 2, 3, 3, 3, 4, 5, 5, 5, 5, 6, 6, 7 and 8.
Solution:
Question 8.
Solution:
Measures of Central Tendency Exercise 24E – Selina Concise Mathematics Class 10 ICSE Solutions
Question 1.
Solution:
Question 2.
Solution:
Question 3.
Solution:
Question 4.
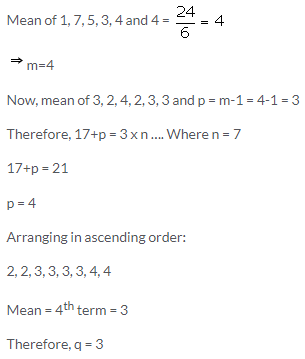
The mean of 1, 7, 5, 3, 4 and 4 is m. The numbers 3, 2, 4, 2, 3, 3 and p have mean m-1 and median q. Find p and q.
Solution:
Question 5.
Solution:
Question 6.
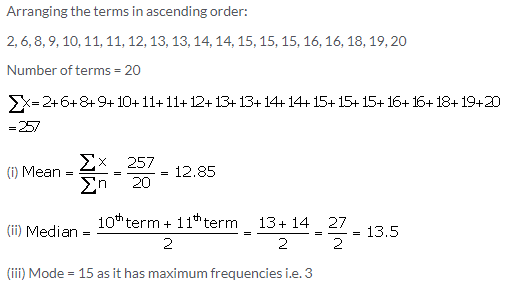
The marks of 20 students in a test were as follows:
2, 6, 8, 9, 10, 11, 11, 12, 13, 13, 14, 14, 15, 15, 15, 16, 16, 18, 19 and 20.
Calculate:
(i) the mean (ii) the median (iii) the mode
Solution:
Question 7.
Solution:
Question 8.
Solution:
Question 9.
Solution:
Question 10.
Solution:
Question 11.
Solution:
Question 12.
Solution:
Question 13.
Solution:
Question 14.
Solution:
Question 15.
Solution:
Question 16.
The median of the observations 11, 12, 14, (x – 2) (x + 4), (x + 9), 32, 38, 47 arranged in ascending order is 24. Find the value of x and hence find the mean.
Solution:
Data in ascending order:
11, 12, 14, (x – 2), (x + 4), (x + 9), 32, 38, 47
Total number of observations = n = 9 (odd)
⇒ Median – \(\left(\frac{n+1}{2}\right)^{t h}\) term = \(\left(\frac{9+1}{2}\right)^{t h}\) term =5th term
Given, median = 24
⇒ 5th term = 24
⇒ x + 4 = 24
⇒ x = 20
Thus, the observation are as follows:
11, 12, 14, 18, 24, 29, 32, 38, 47
∴ Mean = \(\frac{\sum x}{n}=\frac{11+12+14+18+24+29+32+38+47}{9}=\frac{225}{9}=25\)
Question 17.
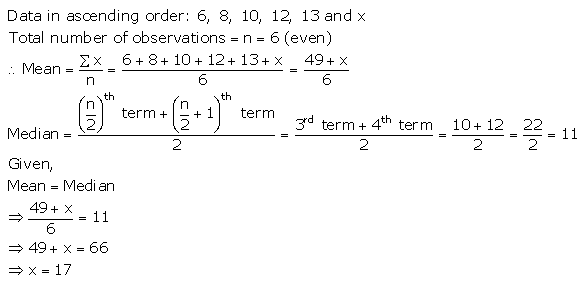
The number 6, 8, 10, 12, 13 and x are arranged in an ascending order. If the mean of the observations is equal to the median, find the value of x.
Solution:
Question 18.
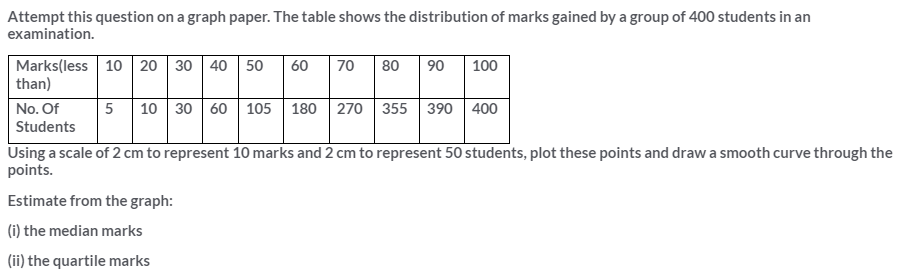
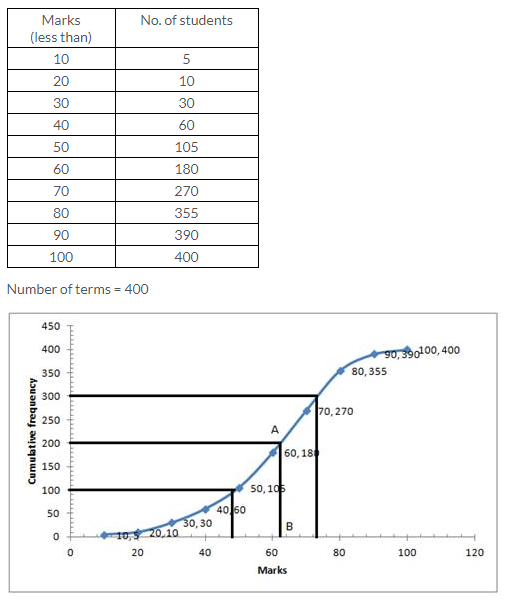
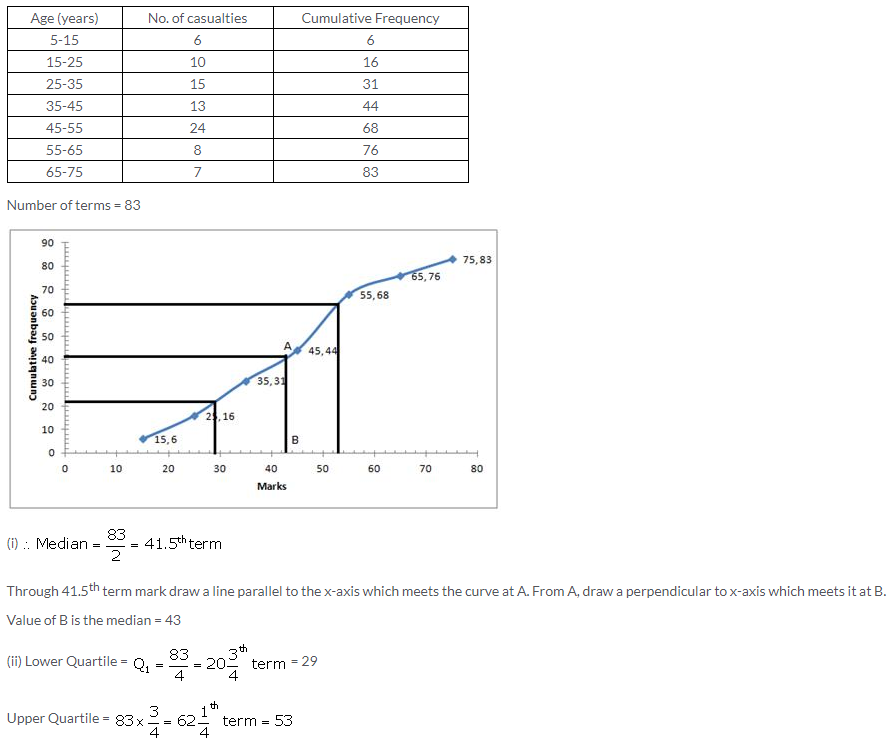
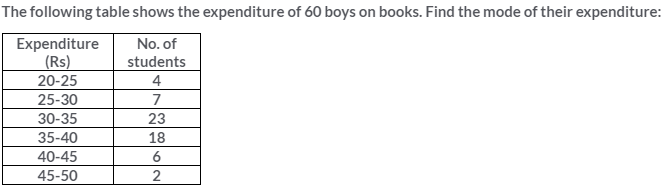
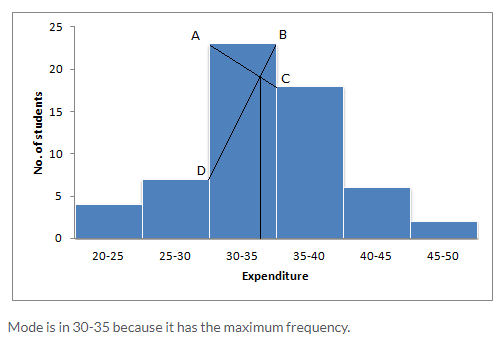
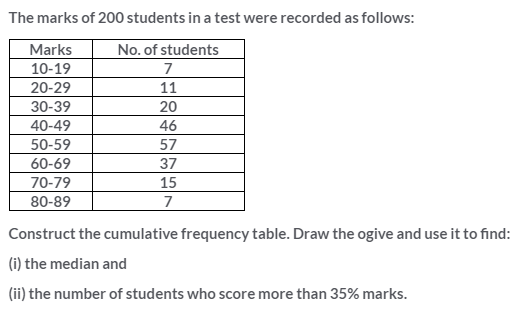
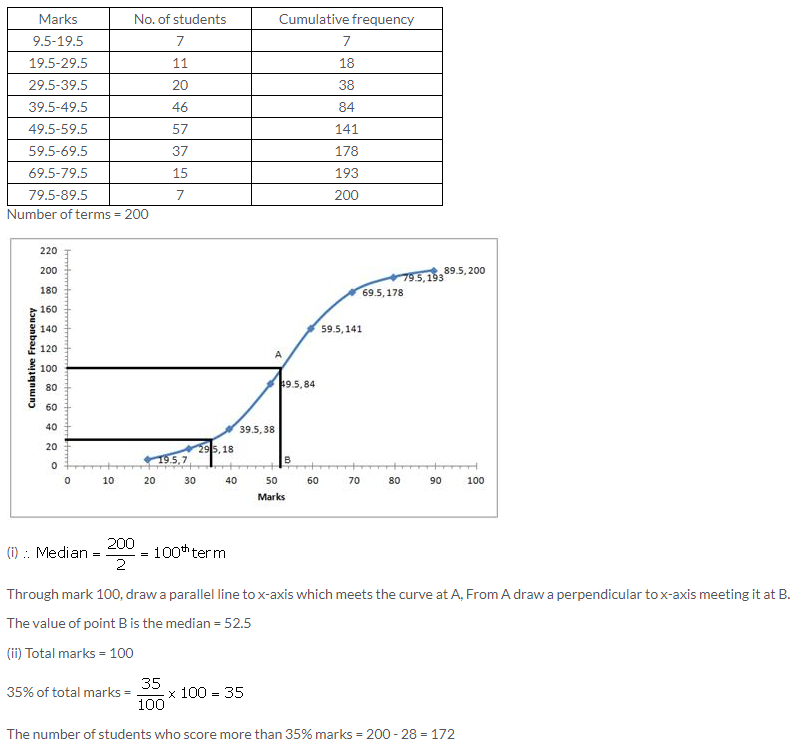
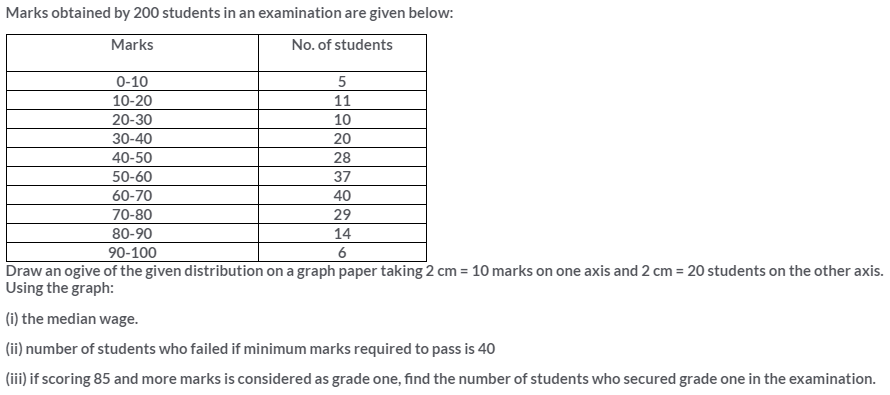
(Use a graph paper for this question). The daily pocket expenses of 200 students in a school are given below :
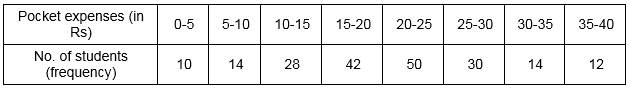
Draw a histogram representing the above distribution and estimate the mode from the graph.
Solution:
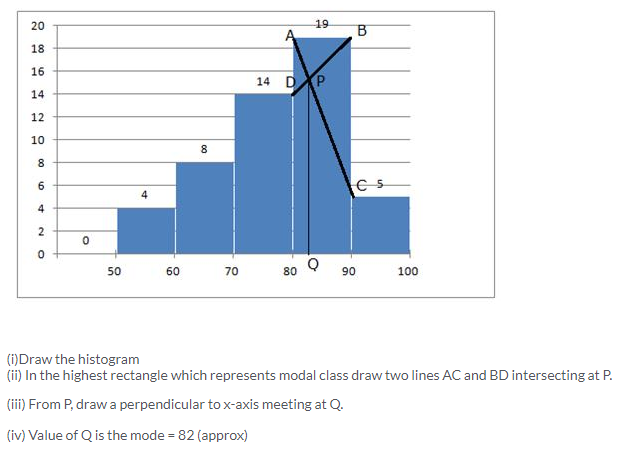
Histogram is as follows:
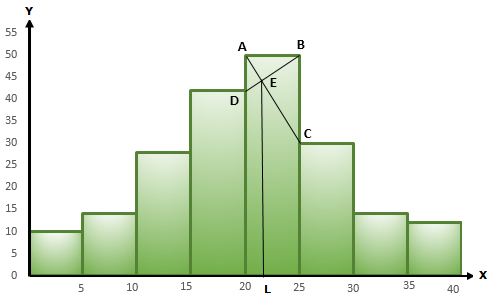
In the highest rectangle which represents modal class draw two lines AC and BD intersecting at E.
From E, draw a perpendicular to x-axis meeting at L.
Value of L is the mode. Hence, mode = 21.5
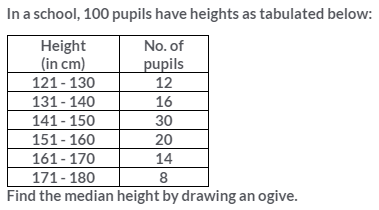
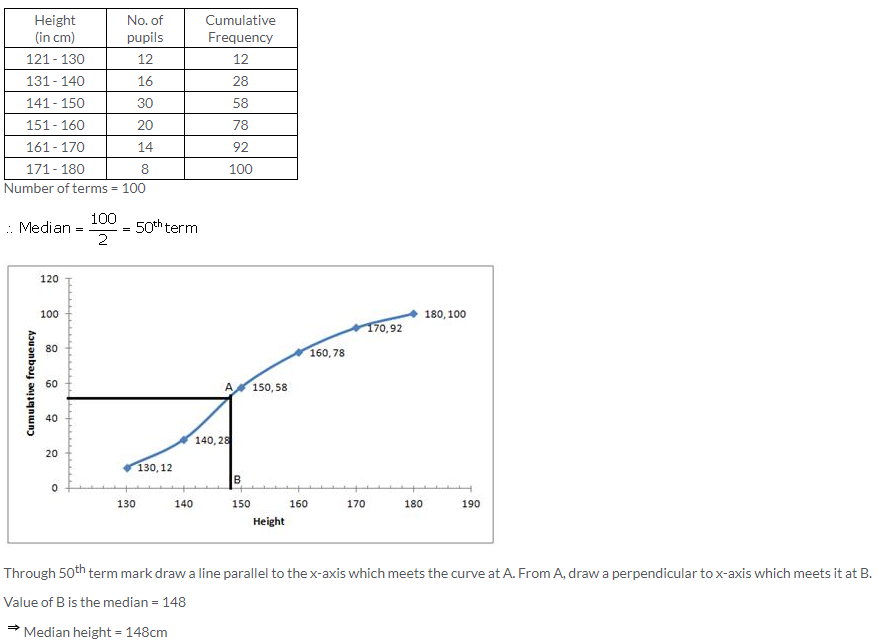
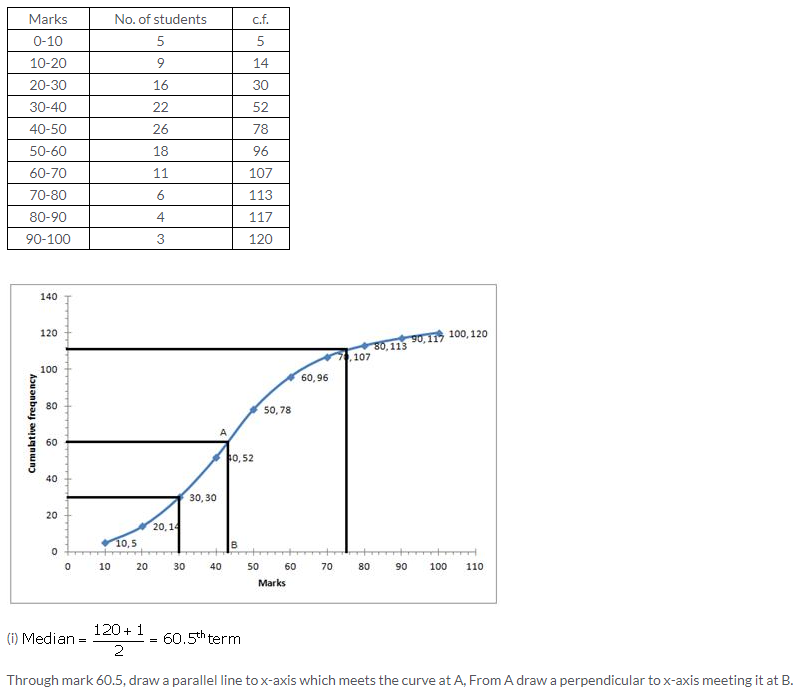
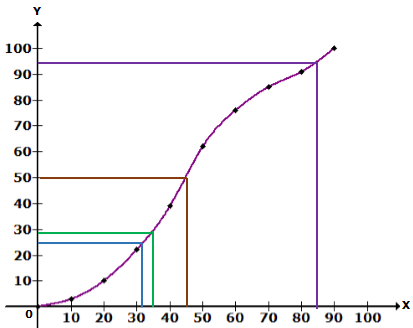
Question 19.
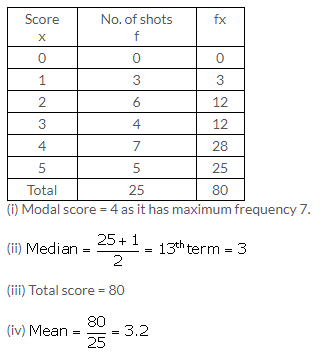
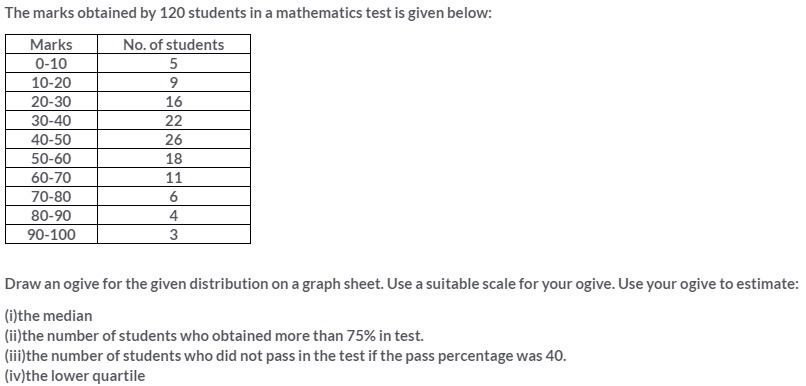
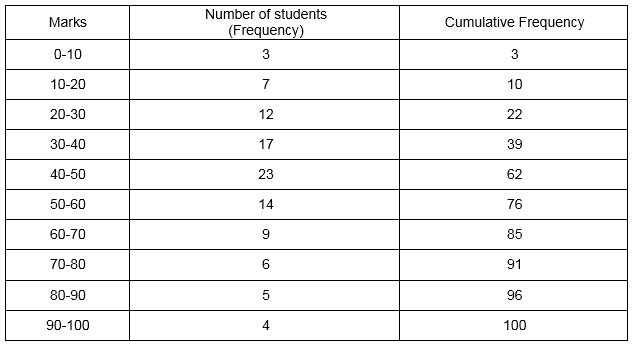
The marks obtained by 100 students in a mathematics test are given below :

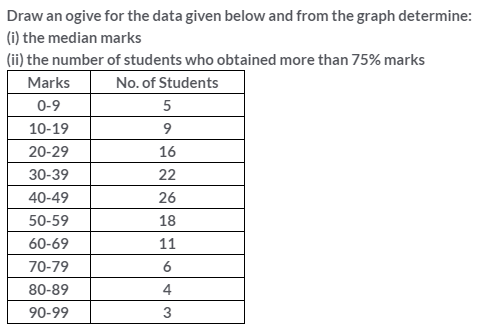
Draw an ogive for the given distribution on a graph sheet.
Use a scale of 2 cm = 10 units on both the axes.
Use the ogive to estimate :
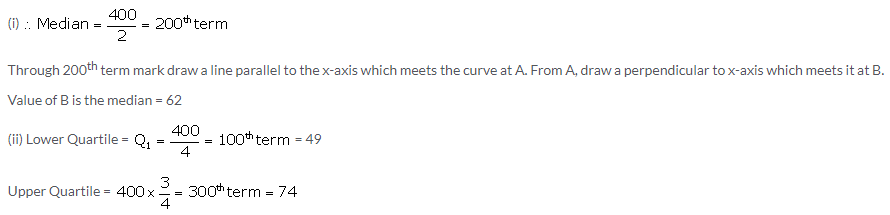
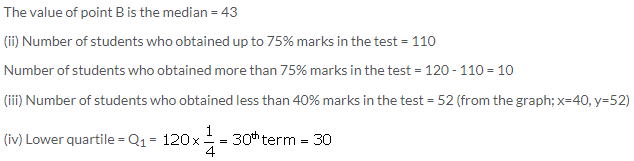
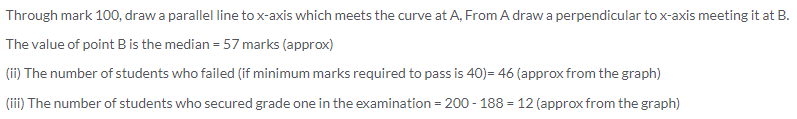
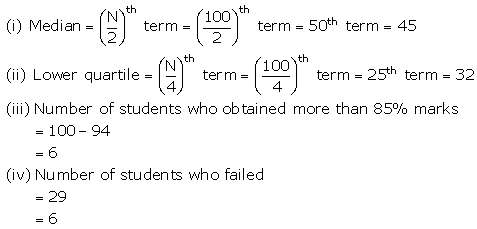
(i) Median
(ii) Lower quartile
(iii) Number of students who obtained more than 85% marks in the test.
(iv) Number of students failed, if the pass percentage was 35.
Solution:
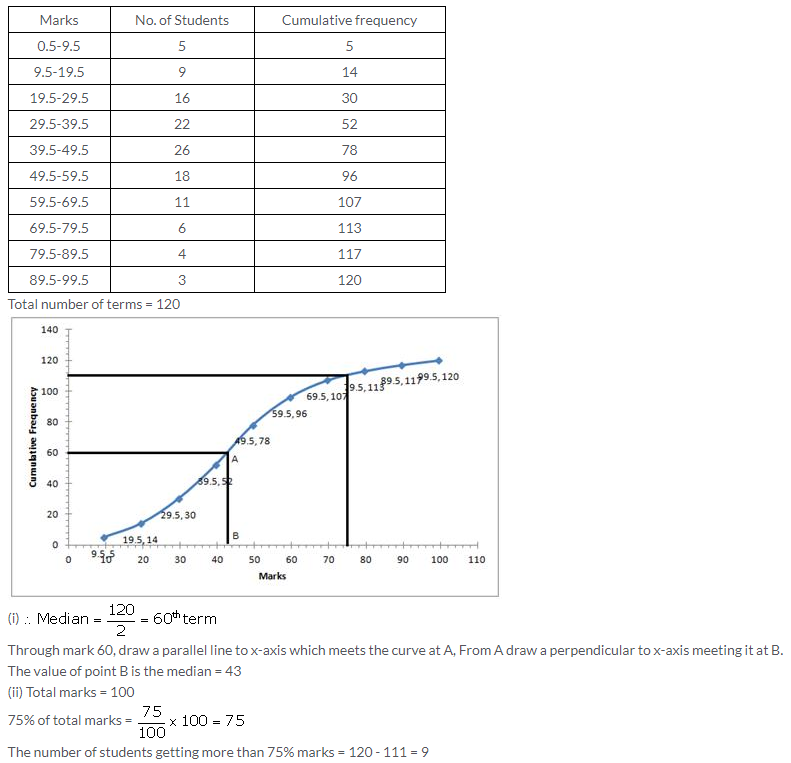
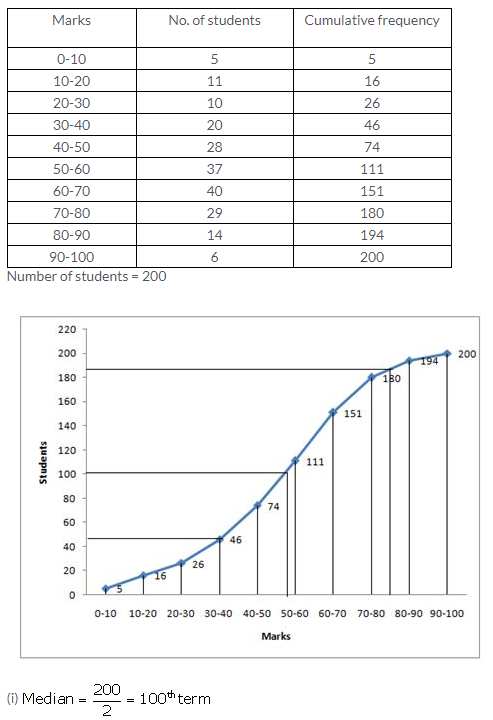
The ogive is as follows:
Question 20.
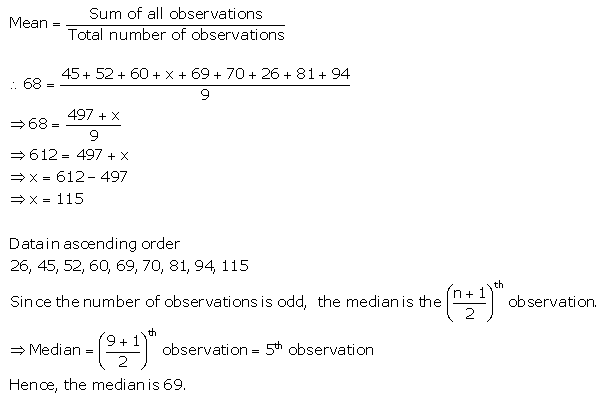
The mean of following numbers is 68. Find the value of ‘x’.
45, 52, 60, x, 69, 70, 26, 81 and 94.
Hence, estimate the median.
Solution:
Question 21.
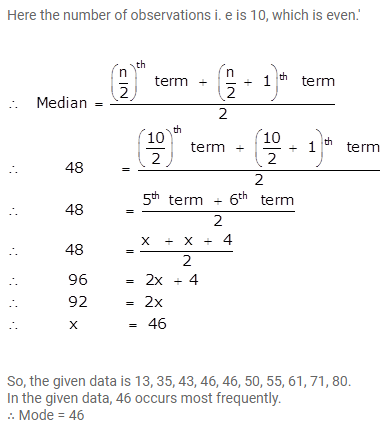
The marks of 10 students of a class in an examination arranged in ascending order is as follows:
13, 35, 43, 46, x, x + 4, 55, 61, 71, 80
If the median marks is 48, find the value of x. Hence, find the mode of the given data.
Solution:
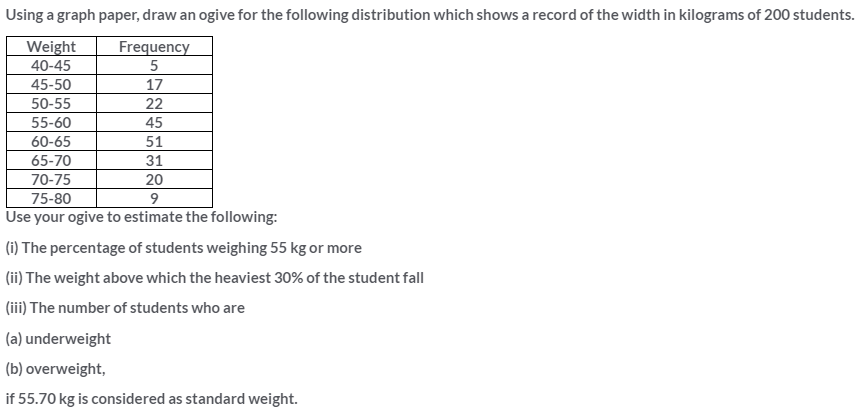
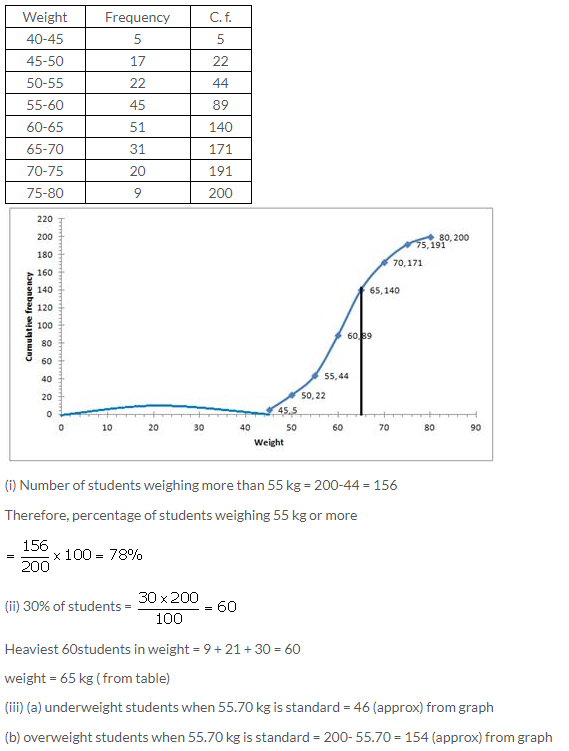
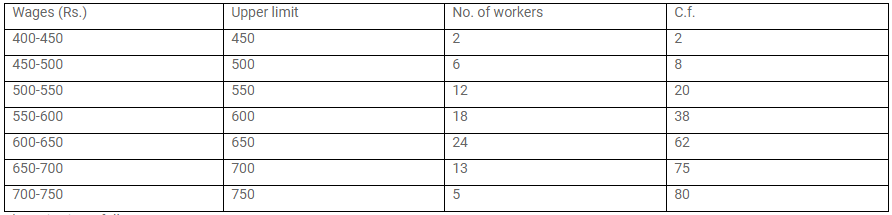
Question 22.
The daily wages of 80 workers in a project are given below.
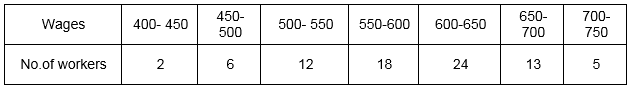
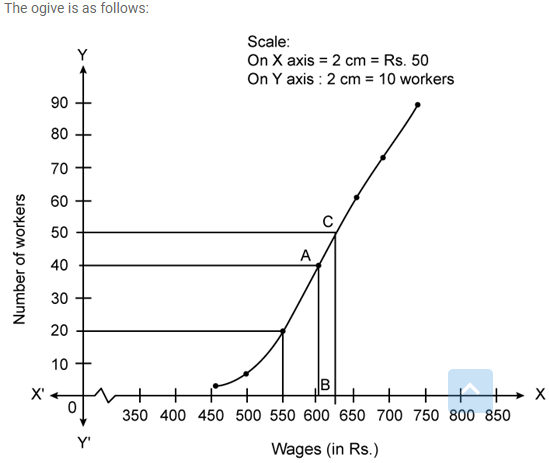
Use a graph paper to draw an ogive for the above distribution. (Use a scale of 2 cm = Rs. 50 on x – axis and 2 cm = 10 workers on y – axis). Use your ogive to estimate.
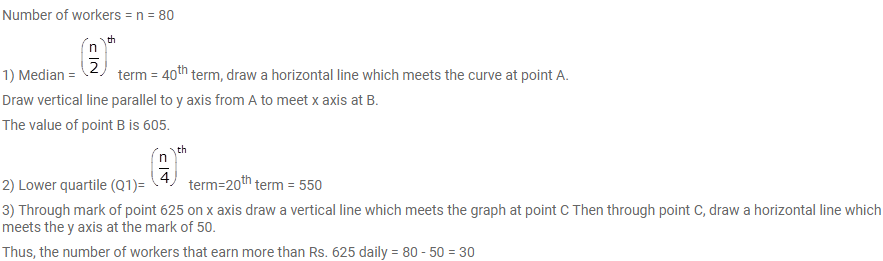
i. the median wages of the workers.
ii. thelower quartile wage of workers.
iii. the number of workers who earn more than Rs. 625 daily.
Solution:
Question 23.
The histogram below represents the scores obtained by 25 students in a Mathematics mental test. Use the data to:
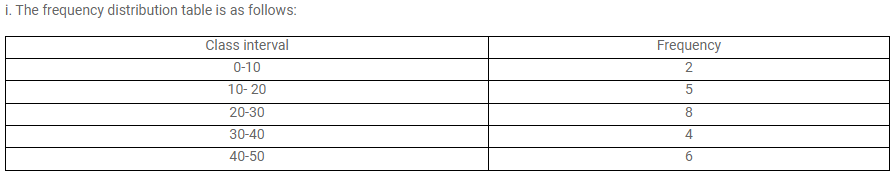
i. Frame a frequency distribution table.
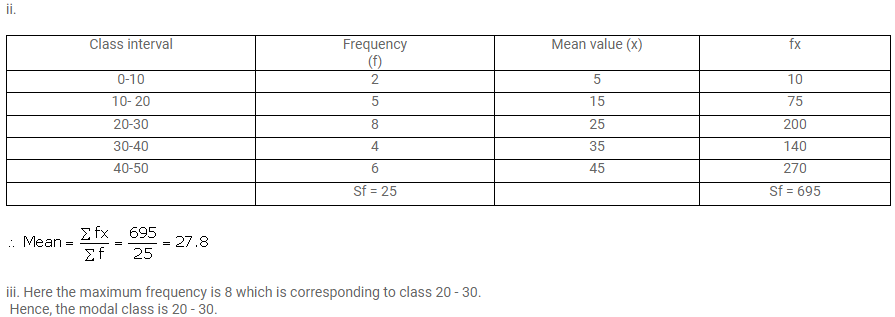
ii. To calculate mean.
iii. To determine the Modal class.
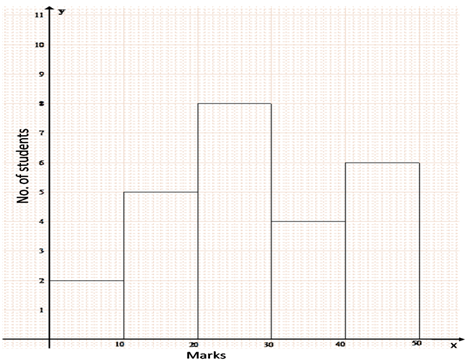
Solution:
More Resources for Selina Concise Class 10 ICSE Solutions