Kerala Plus One Economics Chapter Wise Previous Questions Chapter 15 Measures of Central Tendency
Question 1.
Rewrite the following statement correctly: (March 2009)
A value which divides the data into 10 (ten) equal parts is called percentiles.
Answer:
The value which divides the data into 10 equal parts is called deciles.
Question 2.
The following information relates to the daily income of 150 families. Calculate the arithmetic mean. (March 2009)
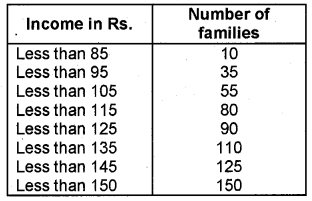
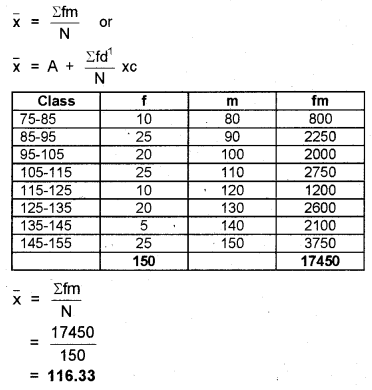
Answer:
Arithmetic mean,
Question 3.
The following data gives the ages of 20 agricultural labourers. Calculate the median age. (March 2009)
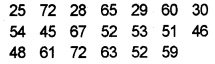
Answer:
Median = Size of \(\left(\frac{N+1}{2}\right)^{t h}\) item = 52.5
Question 4.
Find the modal value of income obtained by 20 workers in a company. (Say 2009)
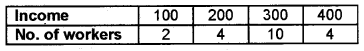
Answer:
300
Question 5.
The following data shows the weekly income of 10 families. (Say 2009)
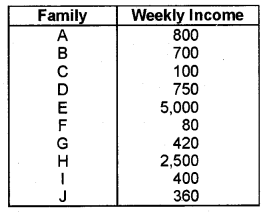
Compute the average family income.
Answer:
\(\bar{x}=\frac{\Sigma x}{N}\) = 1111
Question 6.
Marks obtained by six students in a class are given below. Derive an equation of Arithmetic Mean. Calculate the Arithmetic Mean and explain the other characteristics of Arithmetic Mean by using the data: (March 2010)
Anil = 800, Arun = 750, Binil = 650, Sunil = 520, Anoop = 340, Sooraj = 810.
Answer:
Mean = \(\frac{\Sigma x}{N}\)
Σx = 800 + 750 + 650 + 520 + 340 + 810 = 3870
N = 6
\(\bar{x}=\frac{\sum x}{N}\) = \(\frac{3870}{6}\) = 645
Question 7.
Correct the following sentences: (March 2011)
- The sum of deviations of items from the median is zero.
- An average alone is enough to compare series.
- The upper quartile has 25% of the items of the distribution below it.
- Mode is the middlemost item of a series.
Answer:
- The sum of deviation of items from mean is zero.
- The average alone is not enough to compare series.
- The upper quartile has 75% of the items of the distribution below it.
- Median is the middlemost item of a series.
Question 8.
The following table shows daily wages and the number of workers in a factory. Find the median wage. (March 2011)
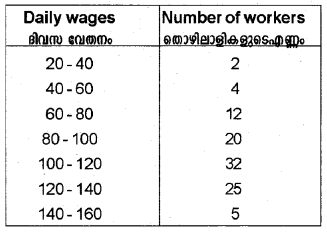
Answer:
Calculate median for continuous series by using the formula,
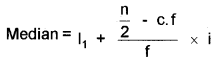
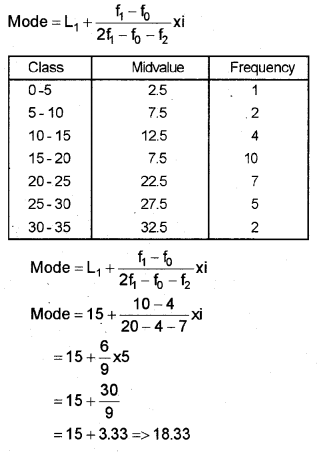
Question 9.
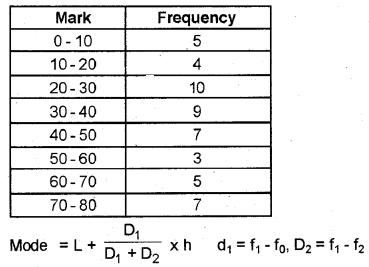
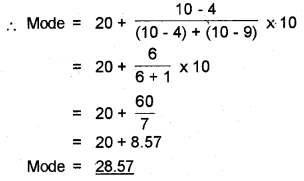
Calculate the mode using a formula and locate the mode graphically to verify the result. (March 2012)
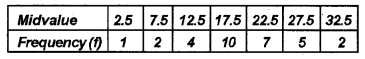
Answer:
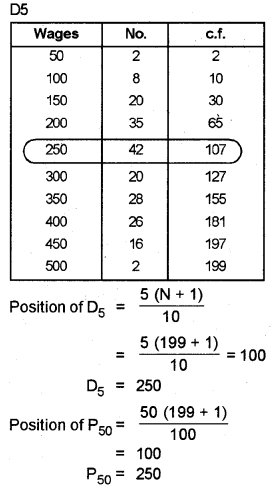
Question 10.
The following table gives data on the daily wages of 199 workers in a factory. Calculate D5 and P50 of the following series. Comment on the result. (March 2012)
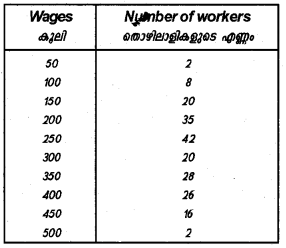
Answer:
Question 11.
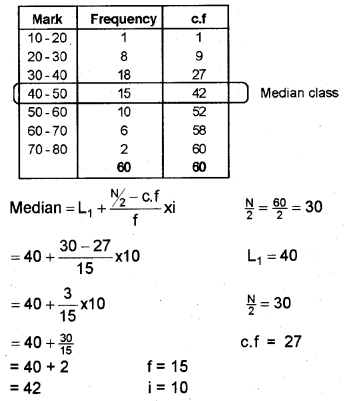
The marks obtained by 60 students in the annual examination is given below. Calculate the mean, median, and mode. (Say 2012)
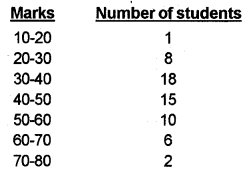
Answer:
a) Mean
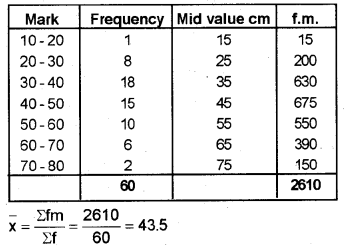
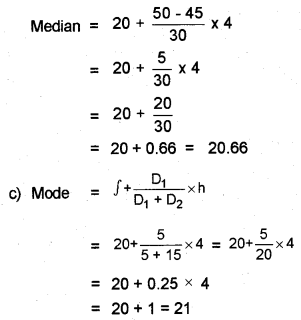
b) Median
c) Mode
Mode = 3 × median – 2 × mean
= 3 × 42 – 2 × 43.5
= 126 – 87
= 39
Question 12.
Define Arithmetic mean. (Say 2012)
Answer:
The arithmetic mean is the value obtained by dividing the sum of a set of quantities by the number of quantities in the set.
Suppose we have a data set containing the values a1, ………, an.
The arithmetic mean A is defined by the formula

If the data set is a statistical population (i.e., consists of every possible observation and not just a subset of them), then the mean of that population is called the population mean. If the data set is a statistical sample (a subset of the population) we call the statistic resulting from this calculation a sample mean.
The arithmetic mean of a variable is often denoted by a bar, for example as in \(\bar{x}\)s (read “x bar”), which is the mean of the n values x1, x2,…. xn.
Question 13.
“Watching the reactions of the respondent can provide supplementary information.” Identify the mode of data collection mentioned here. (March 2013)
Answer:
Personal Interview
Question 14.
Heights of 10 plants in a garden are given below. (March 2013)
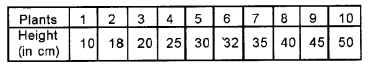
a) Find the mean height.
b) State the interesting property of A.M.
Answer:
a) Arithmetic mean (AM) = ΣX/N = 305/10 = 30.5
Hence, mean height = 30.5 cm
b) i) Mode
ii) Median
iii) Mode or median
iv) Mode or median
v) Mean
vi) Mode or mean
vii) Median
Question 15.
Ashna made the following statement. (March 2013)
“Arithmetic mean is always between the median and the mode.”
Correct the statement if it is wrong.
Answer:
Wrong. Median is always between mean and mode.
Question 16.
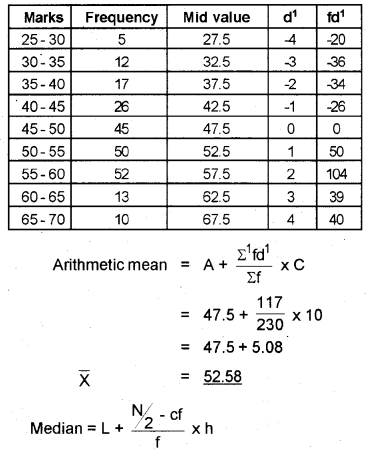
The following table shows marks scored by 230 students in an examination. Find the mean median and mode of the series. (Say 2013)
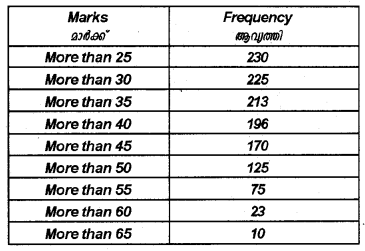
Answer:
Here cumulative frequency is given first we should arrange it in frequency distribution in class intervals.
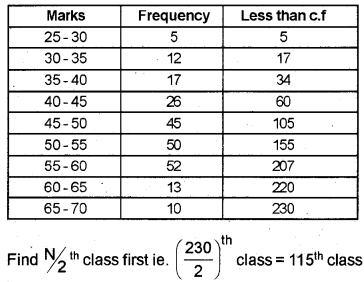
L = Lower limit of the median class
cf = Cumulative frequency of the class proceeding the median class
f = Frequency of median class
h = Magnitude of the median class interval
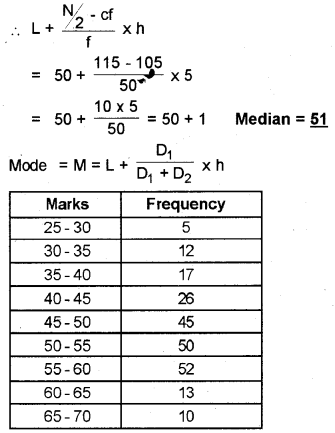
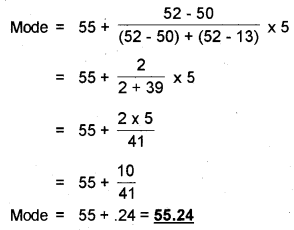
L = Lower limit of modal class
D1 = Difference between the frequency of the modal class and frequency of pre modal class
D2 = Difference between the modal class and post modal class
Question 17.
Data represented through a histogram can help in the finding graphically the ________ (March 2014)
a) mean
b) mode
c) median
d) standard deviation
Answer:
b) mode
Question 18.
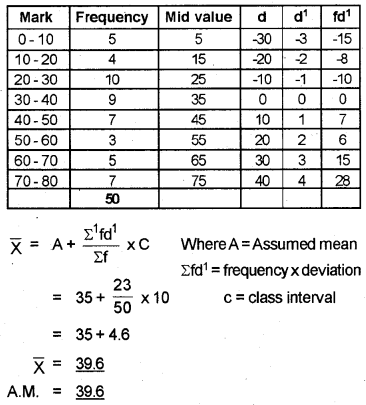
The following data shows the marks obtained by 50 students of a class in a test. (March 2014)
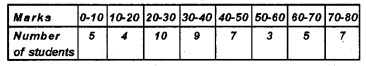
Find the arithmetic mean, median, and mode.
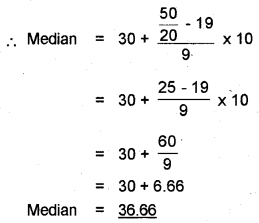
Answer:
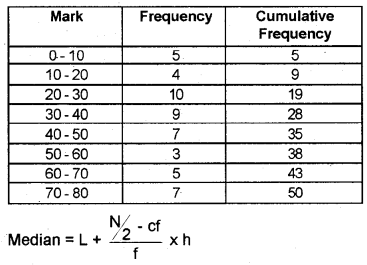
Where L = Lower limit of the median class
cf = Cumulative frequency of preceding class
f = Frequency of median class
h = Class interval of the median class
Where L = Lower limit of modal class
D1 = Difference between the frequency of modal class and frequency of pre modal class
D2 = Difference between the frequency of modal class and frequency of post modal class
h = Class interval of modal class
Question 19.
Prepare a seminar paper on the several statistical measures of central tendency or averages and explain with relevant equations for individual series, discrete series, and continuous series. (March 2014)
Answer:
The measuring of central tendency is a way of summarizing the data in the form of a typical or representative value.
Arithmetic Mean
There are several statistical measures of central tendency or “averages”. The three most commonly used averages are:
- Arithmetic Mean
- Median
- Mode
There are another two more types of averages i.e. Geometric Mean and Harmonic Mean, which are suitable in certain situations.
The arithmetic mean is the most commonly used measure of central tendency. It is defined as the sum of the values of all observations divided by the number of observations and is usually denoted by x.
In general, if there are N observations as X1, X2, X3, ………., XN, then the Arithmetic Mean is given by
\(\bar{x}=\frac{x_{1}+x_{2}+x_{3}+\ldots \ldots \ldots+x_{n}}{N}\)
Arithmetic Mean: The calculation of arithmetic mean can be studied under two broad categories:
- Arithmetic Mean for Ungrouped Data.
- Arithmetic Mean for Grouped Data.
Arithmetic Mean for Series of Ungrouped Data
Direct Method: Arithmetic mean by the direct method is the sum of all observations in a series divided by the total number of observations.
Assumed Mean Method: If the number of observations in the data is more and/or figures are large, it is difficult to compute the arithmetic mean by the direct method. The computation can be made easier by using the assumed mean method.
Step Deviation Method: The calculations can be further simplified by dividing all the deviations taken from the assumed mean by the common factors. The objective is to avoid large numerical figures.
An interesting property of A.M: It is interesting to know and useful for checking your calculation that the sum of deviations of items about the arithmetic mean is always equal to zero. Symbolically, S(X – X) = 0. However, the arithmetic mean is affected by extreme values. Any large value, on either end, can push it up or down.
Median
The arithmetic mean is affected by the presence of extreme values in the data. If you take a measure of central tendency which is based on the middle position of the data, it is not affected by extreme items. Median is that positional value of the variable which divides the distribution into two equal parts, one part comprises all values greater than or equal to the median value and the other comprises all values less than or equal to it. The Median is the “middle” element when the data set is arranged in order of magnitude.
Computation of median: The median can be easily computed by sorting the data from smallest to largest and counting the middle value.
Quartiles: Quartiles are the measures which divide the data into four equal parts; each portion contains equal number of observations. Thus, there are three quartiles. The first Quartile (denoted by Q1) or lower quartile has 25% of the items of the distribution below it and 75% of the items are greater than it. The second Quartile (denoted by Q2)or median has 50% of items below it and 50% of the observations above it. The third Quartile (denoted by Q3) or upper Quartile has 75% of the items of the distribution below it and 25%of the items above it. Thus, Q1 and Q3 denote the two limits within which central 50% of the data lies.
Percentiles: Percentiles divide the distribution into a hundred equal parts, so you can get 99 dividing positions denoted by P1, P2, P3,……, P99. P50 is the median value.
Mode
Sometimes, you may be interested in knowing the most typical value of a series or the value around which the maximum concentration of items occurs. The word mode has been derived from the French word “la Mode” which signifies the most fashionable values of distribution because it is repeated the highest number of times in the series.
The mode is the most frequently observed data value. It is denoted by Mo.
In the case of continuous frequency distribution, the modal class is the class with the largest frequency.
Relative Position of Arithmetic Mean, Median, and Mode
Suppose we express,
Arithmetic Mean = Me
Median = Mi
Mode = Mo
so that e, i, and o are the suffixes.
The relative magnitude of the three are Me > Mi > Mo
The median is always between the arithmetic mean and the mode.
Question 20.
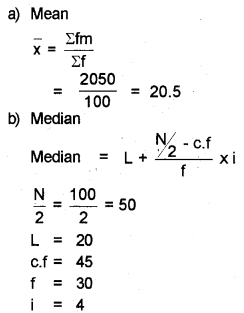
The tea leaves collected by 100 women labourers from a tea estate at Peerumedu for the month of February 2014 are given below. Find the mean, median, and mode. (Say 2014)
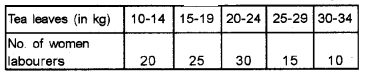
Answer:
Question 21.
As a part of the Teacher’s Day celebrations in your school, you are asked to take a class for the first year Higher Secondary Humanities students on the topic ‘Measures of Central Tendency – Meaning and its measurement. Prepare a note for that. (Say 2014)
Answer:
The measuring of central tendency is a way of summarizing the data in the form of a typical or representative value.
Arithmetic Mean
There are several statistical measures of central tendency or “averages”. The three most commonly used averages are:
- Arithmetic Mean
- Median
- Mode
There are another two more types of averages i.e. Geometric Mean and Harmonic Mean, which are suitable in certain situations.
The arithmetic mean is the most commonly used measure of central tendency. It is defined as the sum of the values of all observations divided by the number of observations and is usually denoted by x.
In general, if there are N observations as X1, X2, X3, ………., XN, then the Arithmetic Mean is given by
\(\bar{x}=\frac{x_{1}+x_{2}+x_{3}+\ldots \ldots \ldots+x_{n}}{N}\)
Arithmetic Mean: The calculation of arithmetic mean can be studied under two broad categories:
- Arithmetic Mean for Ungrouped Data.
- Arithmetic Mean for Grouped Data.
Arithmetic Mean for Series of Ungrouped Data
Direct Method: Arithmetic mean by the direct method is the sum of all observations in a series divided by the total number of observations.
Assumed Mean Method: If the number of observations in the data is more and/or figures are large, it is difficult to compute the arithmetic mean by the direct method. The computation can be made easier by using the assumed mean method.
Step Deviation Method: The calculations can be further simplified by dividing all the deviations taken from the assumed mean by the common factors. The objective is to avoid large numerical figures.
An interesting property of A.M: It is interesting to know and useful for checking your calculation that the sum of deviations of items about the arithmetic mean is always equal to zero. Symbolically, S(X – X) = 0. However, the arithmetic mean is affected by extreme values. Any large value, on either end, can push it up or down.
Median
The arithmetic mean is affected by the presence of extreme values in the data. If you take a measure of central tendency which is based on the middle position of the data, it is not affected by extreme items. Median is that positional value of the variable which divides the distribution into two equal parts, one part comprises all values greater than or equal to the median value and the other comprises all values less than or equal to it. The Median is the “middle” element when the data set is arranged in order of magnitude.
Computation of median: The median can be easily computed by sorting the data from smallest to largest and counting the middle value.
Quartiles: Quartiles are the measures which divide the data into four equal parts; each portion contains an equal number of observations. Thus, there are three quartiles. The first Quartile (denoted by Q1) or lower quartile has 25% of the items of the distribution below it and 75% of the items are greater than it. The second Quartile (denoted by Q2)or median has 50% of items below it and 50% of the observations above it. The third Quartile (denoted by Q3) or upper Quartile has 75% of the items of the distribution below it and 25%of the items above it. Thus, Q1 and Q3 denote the two limits within which central 50% of the data lies.
Percentiles: Percentiles divide the distribution into a hundred equal parts, so you can get 99 dividing positions denoted by P1, P2, P3,……, P99. P50 is the median value.
Mode
Sometimes, you may be interested in knowing the most typical value of a series or the value around which the maximum concentration of items occurs. The word mode has been derived from the French word “la Mode” which signifies the most fashionable values of distribution because it is repeated the highest number of times in the series.
The mode is the most frequently observed data value. It is denoted by Mo.
In the case of continuous frequency distribution, the modal class is the class with the largest frequency.
Relative Position of Arithmetic Mean, Median, and Mode
Suppose we express,
Arithmetic Mean = Me
Median = Mi
Mode = Mo
so that e, i, and o are the suffixes.
The relative magnitude of the three are Me > Mi > Mo
The median is always between the arithmetic mean and the mode.
Question 22.
The following data shows the marks obtained by six students in Class XI for a class test. (March 2015)
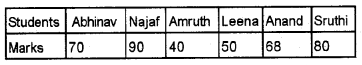
Calculate the Arithmetic Mean of marks.
Answer:
Arithmetic mean in individual series \((\bar{x})=\frac{\Sigma x}{N}\)
Here, Σx = 448, N = 7
\(\bar{x}=\frac{448}{7}\) = 64
Question 23.
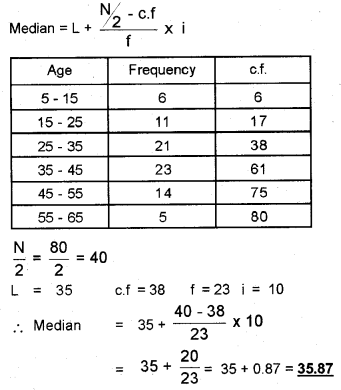
The following table shows the ages of the patients admitted to a hospital for a year. (March 2015)

Find the median age.
Answer:
Question 24.
The most frequently observed data value. (Say 2015)
Answer:
Mode
Question 25.
Sum of the values of all observations divided by the number of observations. (Say 2015)
Answer:
Arithmetic Mean
Question 26.
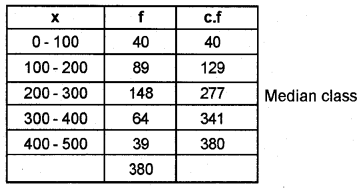
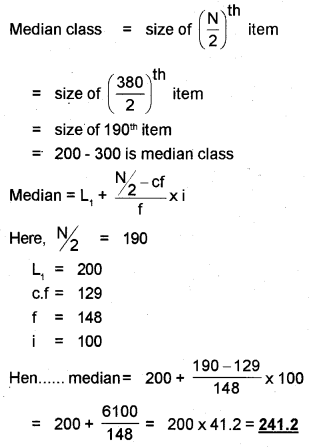
The size of landholdings of 380 families in a village is given below. Find the median size of landholdings. (Say 2015)
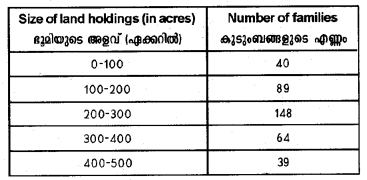
Answer:
Median
Question 27.
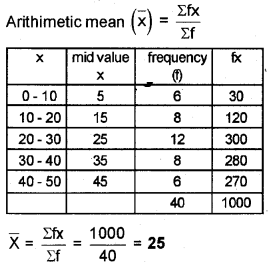
Calculate the arithmetic mean from the following data: (March 2016)
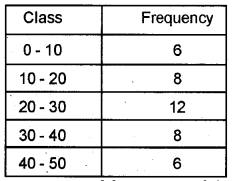
Answer:
Question 28.
The algebraic sum of deviation of a set of values from Arithmetic mean is _________ (March 2016)
a) n
b) 0
c) 1
d) None of these
Answer:
b) 0
Question 29.
________ divides the series into two equal parts. (March 2016)
Answer:
Median
Question 30.
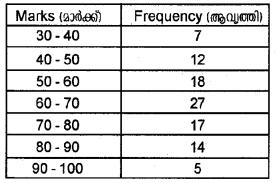
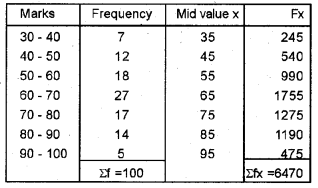
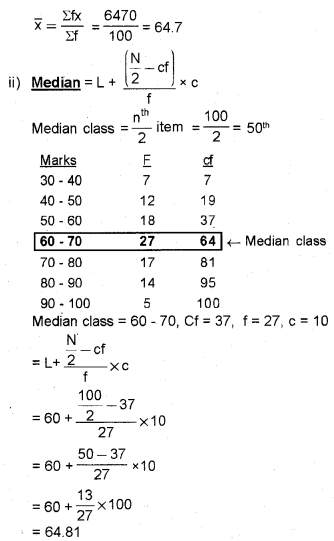
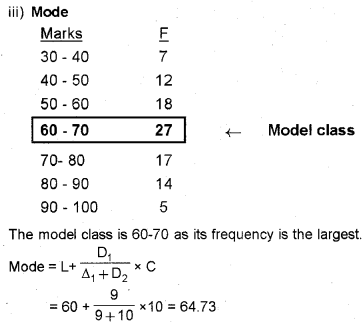
The following data shows marks obtained by 100 students in Economics in the model examination. Calculate the arithmetic mean, median, and mode. (Say 2016)
Answer:
i) AM (Mean)
Question 31.
The heights (in cm) of 11 plants in a garden are (March 2017)
![]()
a) Choose the mode
b) Calculate the mean and median height of the plants, by using the equations.
Answer:
a) mode 10
b) Mean = \(\frac{\sum x}{N}=\frac{124}{11}\) = 11.2
c) Median = ?
Data in assending order
3, 4, 5, 8, 10, 10, 12, 13, 17, 20, 22
Median = \(\frac{N+1}{2}=\frac{11+1}{2}=\frac{12}{2}\) = 6th item
Median = 10