Kerala Plus One Economics Chapter Wise Previous Questions Chapter 13 Organisation of Data
Question 1.
Daily wages of 24 workers in a factory are given below. Prepare a Frequency Array. (Say 2009)
25, 40, 25, 35, 30, 25, 25, 30, 20, 35, 35, 20, 30, 20, 35, 35, 30, 25, 30, 40, 30, 20, 25, 30
Answer:
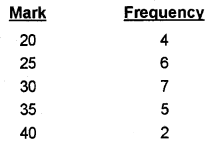
Question 2.
Marks obtained by 50 students in an examination are given below. Write the frequency distribution of these marks. (March 2010)
8, 25, 14, 7, 33, 61, 78, 54, 81, 27, 21, 18, 67, 58, 55, 21, 90, 74, 53, 38, 42, 63, 71, 19, 20, 28, 37, 41, 85, 29, 64, 79, 88, 97, 19, 21, 41, 77, 59, 69, 52, 44, 75, 81, 27, 91, 98, 39, 86, 19.
Answer:
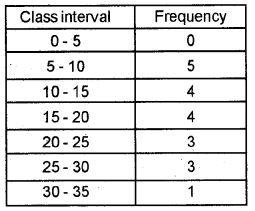
Question 3.
In the frequency distribution table given below the mid-values and frequencies are given. Write the corresponding class. (March 2010)
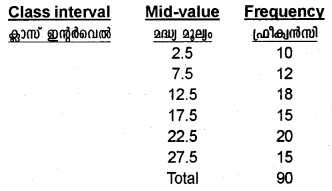
Answer:
Class interval
0 – 5
5 – 10
10 – 15
15 – 20
20 – 25
25 – 30
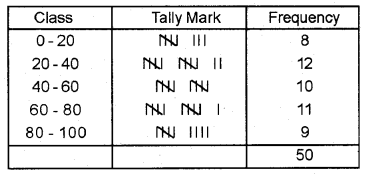
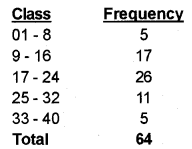
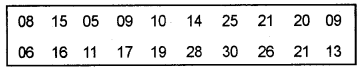
Question 4.
Marks scored by 64 students in a test paper are given below: (March 2012)
Prepare a frequency distribution with inclusive classes.
Answer:
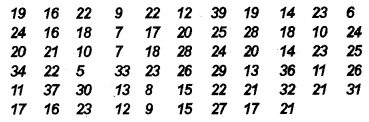
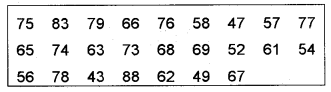
Question 5.
Prepare a frequency distribution table from the following data taking a class interval of 4. (Say 2013)
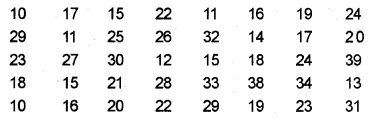
Answer:
Question 6.
Classification of a group of population-based on their age is an example of qualitative classification. (Say 2013)
Answer:
False
Question 7.
Prepare a frequency distribution table by taking class interval of 5 for the following data (exclusive method). (March 2014)
1, 10, 3, 6, 3, 2, 2, 4, 8, 3, 12, 5, 5, 2, 9, 12, 8, 6, 5, 15, 8, 81, 7, 4, 17, 14, 8, 6, 12
Answer:
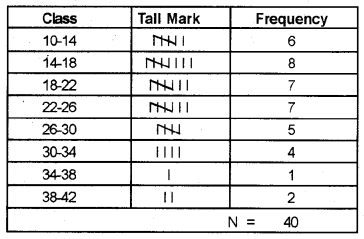
Question 8.
Vipin classified the students of a school on the basis of their heights as follows. (Say 2014)
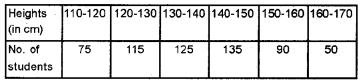
- Name the classification.
- Tell him the other ways of classification.
- Find the class interval and define it.
- State the class marks of the first and the last class.
Answer:
- Exclusive method
- Inclusive method
- The class interval is the size of each class into which a range of a variable is divided
- 10
Question 9.
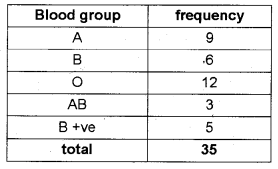
The blood groups of 35 students of Class XI are recorded as follows: (March 2015)
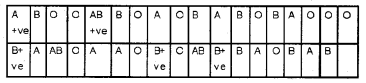
Represent this data in the form of a frequency array table.
Answer:
Question 10.
Cumilative frequency curves are called _________ (March 2015)
a) histograms
b) ogives
c) frequency polygons
d) Frequency curves
Answer:
b) ogives
Question 11.
Under exclusive method ________ (Say 2015)
a) the upper-class limit of a class is included in the class interval
b) the upper-class limit of a class is included in the class interval
c) the lower class limit of a class is excluded in the class interval
d) None of these
Answer:
a) the upper-class limit of a class is included in the class interval
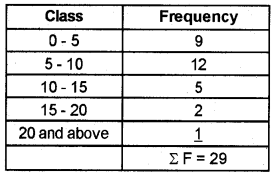
Question 12.
Prepare a frequency distribution by exclusive method taking class interval of 5, from the following data: (Say 2015)
Answer:
Question 13.
Distinguish between discrete and continuous variables. (March 2016)
Answer:
A continuous variable can take any numerical value
A discrete variable can take only a certain value.
Question 14.
Construct a frequency distribution table from the following data taking class intervals often. (Say 2016)
Answer:
Question 15.
While preparing a frequency distribution from the raw data, name the questions we have to address. Briefly explain in 1½ pages. (March 2017)
(Hint: Four steps in the construction of a frequency distribution)
Answer:
While preparing a frequency distribution the following four points need to be taken into account
- The number of classes we should have
- The size of each class
- Choice of the class limit
- Availability of class frequencies
Number of classes
The first problem is the decision regarding the number of classes into which the raw data are to be classified. In order to avoid difficulties, we have to find out their range. The range is the difference between the largest and the smallest values of the variable.
The size of each class
We can determine the class interval once we decide on the number of classes. Thus these two decisions are interlinked with one another.
The choice of class limits
The choice of class limits is important in forming frequency distribution. There are two methods for the construction of a frequency distribution. They are
- Exclusive method
- Inclusive method
Exclusive method: According to this method upper-class limit is excluded from a class and included in the immediate next class.
Inclusive method: It includes the upper class in that class itself. Thus both class limits are parts of the class boundaries.
Adjustment in a class interval
In order to ensure the continuity of variables, we can change the inclusive classes into exclusive classes. For this, find the difference between the lower limit of the second class and the upper limit of the first class. Divide the difference obtained by two.