Graphing Parabolas
An easy method for graphing parabolas involves preparing a chart. Of course, the graphing calculator can also be used for graphing.

The graphs of quadratic functions, f (x) = ax2 + bx + c, are called parabolas.
Shape of the Graph:
Parabolas have a shape that resembles (but is not the same as) the letter U.
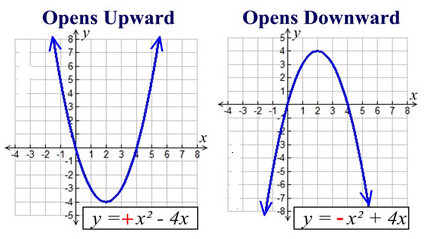
Parabolas may open upward or downward.
If the sign of the leading coefficient, a, is positive (a > 0), the parabola opens upward.
If the sign of the leading coefficient, a, is negative (a < 0), the parabola opens downward.
Parts of the Graph:
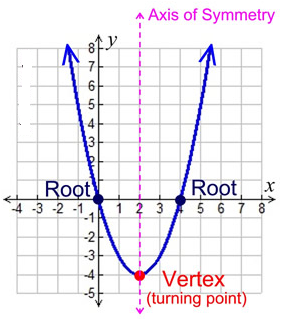
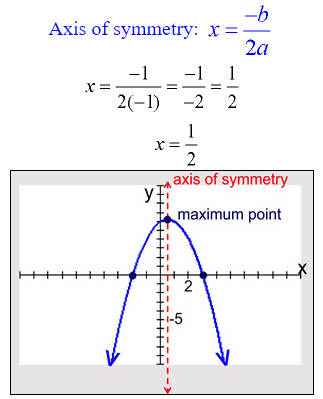
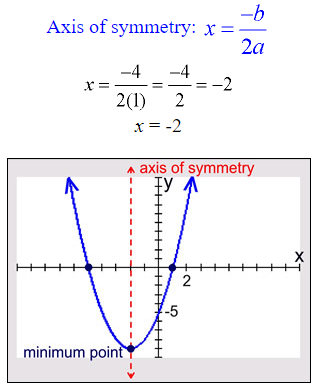
The bottom (or top) of the U is called the vertex, or the turning point. The vertex of a parabola opening upward is also called the minimum point. The vertex of a parabola opening downward is also called the maximum point.
The x-intercepts are called the roots, or the zeros. To find the x-intercepts, set ax2 + bx + c = 0.
The ends of the graph continue to positive infinity (or negative infinity) unless the domain (the x’s to be graphed) is otherwise specified.
Axis of Symmetry:
The parabola is symmetric (a mirror image) about a vertical line drawn through its vertex (turning point). This line is called the axis of symmetry. The equation for the axis of symmetry is

Example 1: Graph Parabola: y = x2 + 4x – 5
Example 2: Graph Parabola: y = -x2 + x + 6