Tree Diagrams
When attempting to determine a sample space (the possible outcomes from an experiment), it is often helpful to draw a diagram which illustrates how to arrive at the answer.
One such diagram is a tree diagram.
In addition to helping determine the number of outcomes in a sample space, the tree diagram can be used to determine the probability of individual outcomes within the sample space.
The probability of any outcome in the sample space is the product (multiply) of all possibilities along the path that represents that outcome on the tree diagram.
Example:
Show the sample space for tossing one penny and rolling one die.
(H = heads, T = tails)
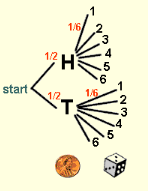
By following the different paths in the tree diagram, we can arrive at the sample space.
Sample space:
{ H1, H2, H3, H4, H5, H6,
T1, T2, T3, T4, T5, T6 }
The probability of each of these outcomes is
1/2 • 1/6 = 1/12
[The Counting Principle could also verify that this answer yields the correct number of outcomes:
2 • 6 = 12 outcomes.]
Example 2:
A family has three children. How many outcomes are in the sample space that indicates the sex of the children? Assume that the probability of male (M) and the probability of female (F) are each 1/2.
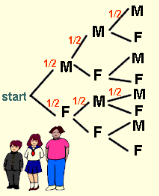
Sample space:
{ MMM
MMF
MFM
MFF
FMM
FMF
FFM
FFF }
There are 8 outcomes in the sample space.
The probability of each outcome is
1/2 • 1/2 • 1/2 = 1/8.
[Again, the Counting Principle could also verify that this result yields the correct number of outcomes:
2 • 2 • 2 = 8 outcomes.]