What is Collection and Organisation of Data
Data
Mr Gupta has done a survey in a reputed school to find out the favourite game of the students.
The information collected from the students of Class VI to Class XII are as follows:
| Game | Basket ball | Volley ball | Foot ball | Cricket | Table tennis | Badminton |
| Number of students | 205 | 215 | 600 | 560 | 156 | 264 |
From the above table, we can easily visualise the following information:
(a) Number of students present on the day of survey.
(b) Which game has got the maximum popularity?
(c) Which game has got the minimum popularity?
(d) What is the fraction of the number of students who like badminton?
The initial step of any investigation is the collection of data. It may be a collection of numbers, figures, facts, or symbols. The information needed or the data collected must be relevant to the need. Collection of information in the form of numerical figures is called data. Literal meaning of data is known facts or facts collected to draw some inference.
There are two types of data—primary data and secondary data.
Primary Data
The data collected directly from the source is called the primary data. For example, the data collected by Mr. Gupta is primary data.
Secondary Data
When the data is collected from an external source, it is called the secondary data. For example,
the data collected from newspapers, magazines, internet, etc. is secondary data.
Note:
Data can be classified as primary and secondary data.
The data collected directly for the first time by the observer is called the primary data.
The data collected from any external source like TV, internet, newspaper, etc. is called the secondary data.
Use of Data Collection
In order to preserve data, we need to collect the data, organise them, and record them so that whenever we want to use the information, we can refer to it.
For example,
(a) Taking attendance by the teacher in the class
(b) Different types of games played by the children
(c) Popular brand of cars
Organisation of data
Organisation of data helps in bringing about meaningful conclusion from the data. For example, a group of students of Class VI took part in a music competition. The judges gave the following grades: 2, 4, 5, 1, 3, 2 etc. Does it make any sense to you? This is data but not meaningful. To make the data meaningful, we have to arrange the data in a tabular form.
| Name of the student | Grade |
| Raju | 2 |
| Lata | 4 |
| Seema | 5 |
| Rehana | 1 |
| Ajay | 3 |
| Rekha | 2 |
| Arnav | 2 |
| Peter | 4 |
| Tripti | 5 |
Hence, understanding and analysing the data become easier by means of tables or pictures.
Frequency
Let us consider an example:
The coach of a cricket team wants to know the runs scored by the players of both the teams in the previous match. He will call each and every player and note down their runs as given below:
20, 35, 40, 25, 47, 50, 20, 35, 86, 20, 38, 75, 98, 20, 40, 50, 102, 20, 38, 40, 86, 75, 25, 38
This way of recording the data does not help him to answer the following questions:
(a) What is the maximum runs scored?
(b) How many players made a half-century?
(c) How many players scored 75 runs or more than 75 runs?
(d) Difference between the maximum and minimum runs scored.
Now, we write the above data in ascending or descending order:
20, 20, 20, 20, 20, 25, 25, 35, 35, 38, 38, 38, 40, 40, 40,47, 50, 50, 75, 75, 86, 86, 98,102
This is a better way of writing the collected data but it is time-consuming and there is always a possibility of missing some numbers, if the information is collected for a larger number of persons. It may he helpful in answering the 215 questions as given in (a) and (d), but we might find it difficult to answer the questions as given in (b) and (c).
When the number of observation is larger, to minimise the number of errors and to make tabulation easier, we can use tally marks. In the tally marks method we draw three columns. In the first column, write runs, in the second column, tally marks, and in the third column, the number of players. Tally marks are always recorded in bunches of five. Fifth tally mark is drawn diagonally across the first four to make a group of five.
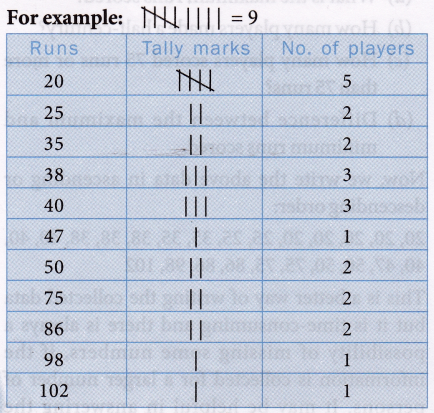
Finally after counting tally marks the actual numbers can be written in the third column which represent frequency. Now, looking at the table we can easily answer the questions (b) and (c), i.e., 2 and 6 respectively.
Note:
- The singular form of data is datum. Data is in plural form but now a days, data is used in both singular and plural forms.
- A tabular form is a form where you can find all information and data in several rows and columns.
- Frequency is the number of times of a repeating event.
- Tally is a symbol like a vertical bar as shown in the chart against each data or item.