Algebra 1 Common Core Answers Chapter 12 Data Analysis and Probability Exercise 12.7

Algebra 1 Common Core Answers Chapter 12 Data Analysis and Probability Exercise 12.7

Algebra 1 Common Core Solutions

Chapter 12 Data Analysis and Probability Exercise 12.7 1LC
Consider events, when rolling a number cube.
Find the theoretical probability for the event to come the number 4 to the face of cube That is finding the value of p(4).
algebra-1-common-core-answers-chapter-12-data-analysis-and-probability-exercise-12-7 1lc

Chapter 12 Data Analysis and Probability Exercise 12.7 2LC
Consider events, when rolling a number cube
Find the theoretical probability for the event to come the numbers less than 3 to the face of cube That is finding the value of P(less than 3)
algebra-1-common-core-answers-chapter-12-data-analysis-and-probability-exercise-12-7 2lc

Chapter 12 Data Analysis and Probability Exercise 12.7 3LC
Consider events, when rolling a number cube
Find the theoretical probability for the complement of an event 3 to the face of cube That is finding the value of P (not 3).
algebra-1-common-core-answers-chapter-12-data-analysis-and-probability-exercise-12-7 3lc
algebra-1-common-core-answers-chapter-12-data-analysis-and-probability-exercise-12-7 3lc1

Chapter 12 Data Analysis and Probability Exercise 12.7 4LC
Consider events, when rolling a number cube.
Find the theoretical probability for the complement of an event not greater than 4 to the faces of cube That is finding the value of P(not greater than 4)
algebra-1-common-core-answers-chapter-12-data-analysis-and-probability-exercise-12-7 4lc
algebra-1-common-core-answers-chapter-12-data-analysis-and-probability-exercise-12-7 4lc1

Chapter 12 Data Analysis and Probability Exercise 12.7 5LC
Consider an experiment, for toss darts at a dartboard 500 times dart hits the bulls-eye 80 times.
Find the experimental probability that dart hit the bull’s-eye.
algebra-1-common-core-answers-chapter-12-data-analysis-and-probability-exercise-12-7 5lc

Chapter 12 Data Analysis and Probability Exercise 12.7 6LC
algebra-1-common-core-answers-chapter-12-data-analysis-and-probability-exercise-12-7 6lc

Chapter 12 Data Analysis and Probability Exercise 12.7 7LC
algebra-1-common-core-answers-chapter-12-data-analysis-and-probability-exercise-12-7 7lc

Chapter 12 Data Analysis and Probability Exercise 12.7 8LC
algebra-1-common-core-answers-chapter-12-data-analysis-and-probability-exercise-12-7 8lc

Chapter 12 Data Analysis and Probability Exercise 12.7 9LC
Certain Event:
The occurrences of the month January in the every coming year contain 31 days. It is the certain likely event Since January month of every year contain 31 days
Highly Unlikely Event: The occurrence of the month febuary in the every coming year contains 29 days This is the highly unlikely event, since some coming year the February month contains 28 days also.

Chapter 12 Data Analysis and Probability Exercise 12.7 10E
algebra-1-common-core-answers-chapter-12-data-analysis-and-probability-exercise-12-7 10e

Chapter 12 Data Analysis and Probability Exercise 12.7 11E
algebra-1-common-core-answers-chapter-12-data-analysis-and-probability-exercise-12-7 11e

Chapter 12 Data Analysis and Probability Exercise 12.7 12E
algebra-1-common-core-answers-chapter-12-data-analysis-and-probability-exercise-12-7 12e

Chapter 12 Data Analysis and Probability Exercise 12.7 13E
algebra-1-common-core-answers-chapter-12-data-analysis-and-probability-exercise-12-7 13e
algebra-1-common-core-answers-chapter-12-data-analysis-and-probability-exercise-12-7 13e1

Chapter 12 Data Analysis and Probability Exercise 12.7 14E
algebra-1-common-core-answers-chapter-12-data-analysis-and-probability-exercise-12-7 14e

Chapter 12 Data Analysis and Probability Exercise 12.7 15E
algebra-1-common-core-answers-chapter-12-data-analysis-and-probability-exercise-12-7 15e

Chapter 12 Data Analysis and Probability Exercise 12.7 16E
algebra-1-common-core-answers-chapter-12-data-analysis-and-probability-exercise-12-7 16e
algebra-1-common-core-answers-chapter-12-data-analysis-and-probability-exercise-12-7 16e1

Chapter 12 Data Analysis and Probability Exercise 12.7 17E
algebra-1-common-core-answers-chapter-12-data-analysis-and-probability-exercise-12-7 17e

Chapter 12 Data Analysis and Probability Exercise 12.7 18E
algebra-1-common-core-answers-chapter-12-data-analysis-and-probability-exercise-12-7 18e
algebra-1-common-core-answers-chapter-12-data-analysis-and-probability-exercise-12-7 18e1

Chapter 12 Data Analysis and Probability Exercise 12.7 19E
Consider events, landing of spinner A spinner is landing which divided into six equal part each part are number with 1 to 6 and three parts colored with blue, one part colored with green, no parts is white and two parts colored with red. Find the theoretical probability for the complement event: that is the parts which are not colored with red That is finding the value of P(not red).
algebra-1-common-core-answers-chapter-12-data-analysis-and-probability-exercise-12-7 19e
algebra-1-common-core-answers-chapter-12-data-analysis-and-probability-exercise-12-7 19e1

Chapter 12 Data Analysis and Probability Exercise 12.7 20E
algebra-1-common-core-answers-chapter-12-data-analysis-and-probability-exercise-12-7 20e
algebra-1-common-core-answers-chapter-12-data-analysis-and-probability-exercise-12-7 20e1

Chapter 12 Data Analysis and Probability Exercise 12.7 21E
algebra-1-common-core-answers-chapter-12-data-analysis-and-probability-exercise-12-7 21e

Chapter 12 Data Analysis and Probability Exercise 12.7 22E
algebra-1-common-core-answers-chapter-12-data-analysis-and-probability-exercise-12-7 22e

Chapter 12 Data Analysis and Probability Exercise 12.7 23E
algebra-1-common-core-answers-chapter-12-data-analysis-and-probability-exercise-12-7 23e

Chapter 12 Data Analysis and Probability Exercise 12.7 24E
algebra-1-common-core-answers-chapter-12-data-analysis-and-probability-exercise-12-7 24e

Chapter 12 Data Analysis and Probability Exercise 12.7 25E
algebra-1-common-core-answers-chapter-12-data-analysis-and-probability-exercise-12-7 25e

Chapter 12 Data Analysis and Probability Exercise 12.7 26E
algebra-1-common-core-answers-chapter-12-data-analysis-and-probability-exercise-12-7 26e

Chapter 12 Data Analysis and Probability Exercise 12.7 27E
algebra-1-common-core-answers-chapter-12-data-analysis-and-probability-exercise-12-7 27e

Chapter 12 Data Analysis and Probability Exercise 12.7 28E
Consider the result of the survey 01100 randomly selected students at a 2000-students high school. 24 student are given the response for go to community college. Find the experimental probability for the student plan to go to community college after graduationS That is find the value of P(community college).
algebra-1-common-core-answers-chapter-12-data-analysis-and-probability-exercise-12-7 28e

Chapter 12 Data Analysis and Probability Exercise 12.7 29E
Consider the result of the survey of 100 randomly selected students at a 2000-students high school
43 student are given the response for go to 4-year college
Find the experimental probability for the student plan to go to 4-year college after graduation. That is find the value of P(4- year college)
algebra-1-common-core-answers-chapter-12-data-analysis-and-probability-exercise-12-7 29e

Chapter 12 Data Analysis and Probability Exercise 12.7 30E
Consider the result of the survey of 100 randomly selected students at a 2000-students high school
15 student are given the response for go to trade school Find the experimental probability for the student plan to go to trade school aller graduation That is finding the value of P(trade school).
algebra-1-common-core-answers-chapter-12-data-analysis-and-probability-exercise-12-7 30e

Chapter 12 Data Analysis and Probability Exercise 12.7 31E
Consider the result of the survey 01100 randomly selected students at a 2000-students high school. 15 student are given the response for go to trade school.
Find the experimental probability of complement of event for the student plan to go to trade school after graduation. That is find the value of P(not trade school).
algebra-1-common-core-answers-chapter-12-data-analysis-and-probability-exercise-12-7 31e

Chapter 12 Data Analysis and Probability Exercise 12.7 32E
Consider the result of the survey 01100 randomly selected students at a 2000-students high school.
15 student are given the response for go to trade school after graduation, and 24 students are plan to go to community school after graduation
Find the experimental probability for the student plan to go to trade school or community school after graduation That is finding the value of P(trade school or community school).
algebra-1-common-core-answers-chapter-12-data-analysis-and-probability-exercise-12-7 32e
algebra-1-common-core-answers-chapter-12-data-analysis-and-probability-exercise-12-7 32e1

Chapter 12 Data Analysis and Probability Exercise 12.7 33E
algebra-1-common-core-answers-chapter-12-data-analysis-and-probability-exercise-12-7 33e

Chapter 12 Data Analysis and Probability Exercise 12.7 34E
algebra-1-common-core-answers-chapter-12-data-analysis-and-probability-exercise-12-7 34e

Chapter 12 Data Analysis and Probability Exercise 12.7 35E
algebra-1-common-core-answers-chapter-12-data-analysis-and-probability-exercise-12-7 35e
algebra-1-common-core-answers-chapter-12-data-analysis-and-probability-exercise-12-7 35e1

Chapter 12 Data Analysis and Probability Exercise 12.7 36E
Consider a transportation statement of company: Out of 80 workers are surveyed at a company. 17 walk to work
algebra-1-common-core-answers-chapter-12-data-analysis-and-probability-exercise-12-7 36e
algebra-1-common-core-answers-chapter-12-data-analysis-and-probability-exercise-12-7 36e1

Chapter 12 Data Analysis and Probability Exercise 12.7 37E
algebra-1-common-core-answers-chapter-12-data-analysis-and-probability-exercise-12-7 37e

Chapter 12 Data Analysis and Probability Exercise 12.7 38E
algebra-1-common-core-answers-chapter-12-data-analysis-and-probability-exercise-12-7 38e
algebra-1-common-core-answers-chapter-12-data-analysis-and-probability-exercise-12-7 38e1

Chapter 12 Data Analysis and Probability Exercise 12.7 39E
algebra-1-common-core-answers-chapter-12-data-analysis-and-probability-exercise-12-7 39e
algebra-1-common-core-answers-chapter-12-data-analysis-and-probability-exercise-12-7 39e1
algebra-1-common-core-answers-chapter-12-data-analysis-and-probability-exercise-12-7 39e2

Chapter 12 Data Analysis and Probability Exercise 12.7 40E
algebra-1-common-core-answers-chapter-12-data-analysis-and-probability-exercise-12-7 40e
algebra-1-common-core-answers-chapter-12-data-analysis-and-probability-exercise-12-7 40e1

Chapter 12 Data Analysis and Probability Exercise 12.7 41E
algebra-1-common-core-answers-chapter-12-data-analysis-and-probability-exercise-12-7 41e
algebra-1-common-core-answers-chapter-12-data-analysis-and-probability-exercise-12-7 41e1

Chapter 12 Data Analysis and Probability Exercise 12.7 42E
algebra-1-common-core-answers-chapter-12-data-analysis-and-probability-exercise-12-7 42e

Chapter 12 Data Analysis and Probability Exercise 12.7 43E
algebra-1-common-core-answers-chapter-12-data-analysis-and-probability-exercise-12-7 43e

Chapter 12 Data Analysis and Probability Exercise 12.7 44E
algebra-1-common-core-answers-chapter-12-data-analysis-and-probability-exercise-12-7 44e

Chapter 12 Data Analysis and Probability Exercise 12.7 45E
algebra-1-common-core-answers-chapter-12-data-analysis-and-probability-exercise-12-7 45e

Chapter 12 Data Analysis and Probability Exercise 12.7 46E
algebra-1-common-core-answers-chapter-12-data-analysis-and-probability-exercise-12-7 46e
algebra-1-common-core-answers-chapter-12-data-analysis-and-probability-exercise-12-7 46e1

Chapter 12 Data Analysis and Probability Exercise 12.7 47E
algebra-1-common-core-answers-chapter-12-data-analysis-and-probability-exercise-12-7 47e
algebra-1-common-core-answers-chapter-12-data-analysis-and-probability-exercise-12-7 47e1

Chapter 12 Data Analysis and Probability Exercise 12.7 48E
algebra-1-common-core-answers-chapter-12-data-analysis-and-probability-exercise-12-7 48e
algebra-1-common-core-answers-chapter-12-data-analysis-and-probability-exercise-12-7 48e1

Chapter 12 Data Analysis and Probability Exercise 12.7 49E
Consider a situation: A basketball team has 11 players You select 5 players to form a group Determine how many different 5-players group can form.
algebra-1-common-core-answers-chapter-12-data-analysis-and-probability-exercise-12-7 49e

Chapter 12 Data Analysis and Probability Exercise 12.7 50E
algebra-1-common-core-answers-chapter-12-data-analysis-and-probability-exercise-12-7 50e
algebra-1-common-core-answers-chapter-12-data-analysis-and-probability-exercise-12-7 50e1

Chapter 12 Data Analysis and Probability Exercise 12.7 51E
algebra-1-common-core-answers-chapter-12-data-analysis-and-probability-exercise-12-7 51e

Chapter 12 Data Analysis and Probability Exercise 12.7 52E
algebra-1-common-core-answers-chapter-12-data-analysis-and-probability-exercise-12-7 52e
algebra-1-common-core-answers-chapter-12-data-analysis-and-probability-exercise-12-7 52e1

Chapter 12 Data Analysis and Probability Exercise 12.7 53E
algebra-1-common-core-answers-chapter-12-data-analysis-and-probability-exercise-12-7 53e
algebra-1-common-core-answers-chapter-12-data-analysis-and-probability-exercise-12-7 53e1

Chapter 12 Data Analysis and Probability Exercise 12.7 54E
algebra-1-common-core-answers-chapter-12-data-analysis-and-probability-exercise-12-7 54e
algebra-1-common-core-answers-chapter-12-data-analysis-and-probability-exercise-12-7 54e1

Chapter 12 Data Analysis and Probability Exercise 12.7 55E
algebra-1-common-core-answers-chapter-12-data-analysis-and-probability-exercise-12-7 55e
algebra-1-common-core-answers-chapter-12-data-analysis-and-probability-exercise-12-7 55e1

Chapter 12 Data Analysis and Probability Exercise 12.7 56E
algebra-1-common-core-answers-chapter-12-data-analysis-and-probability-exercise-12-7 56e
algebra-1-common-core-answers-chapter-12-data-analysis-and-probability-exercise-12-7 56e1

Chapter 12 Data Analysis and Probability Exercise 12.7 57E
algebra-1-common-core-answers-chapter-12-data-analysis-and-probability-exercise-12-7 57e
algebra-1-common-core-answers-chapter-12-data-analysis-and-probability-exercise-12-7 57e1

Chapter 12 Data Analysis and Probability Exercise 12.7 58E
algebra-1-common-core-answers-chapter-12-data-analysis-and-probability-exercise-12-7 58e
algebra-1-common-core-answers-chapter-12-data-analysis-and-probability-exercise-12-7 58e1

Chapter 12 Data Analysis and Probability Exercise 12.7 59E
algebra-1-common-core-answers-chapter-12-data-analysis-and-probability-exercise-12-7 59e
algebra-1-common-core-answers-chapter-12-data-analysis-and-probability-exercise-12-7 59e1

Algebra 1 Common Core Answers Chapter 12 Data Analysis and Probability Exercise 12.8

Algebra 1 Common Core Answers Chapter 12 Data Analysis and Probability Exercise 12.8

Algebra 1 Common Core Solutions

Chapter 12 Data Analysis and Probability Exercise 12.8 1CB
algebra-1-common-core-answers-chapter-12-data-analysis-and-probability-exercise-12-8 1cb
algebra-1-common-core-answers-chapter-12-data-analysis-and-probability-exercise-12-8 1cb1

Chapter 12 Data Analysis and Probability Exercise 12.8 1LC
Consider five cards: in which 3 cards are yellow color, and two cards are red color Out o13 yellow 2 cards are mark with number 5 and 10. and one card is mark with letter B Out 012 red card one card mark with letter D. and other card is number card Therefore. 3 cards are number cards, one is red color and other two are yellow color Two cards are letter cards one is yellow color and other is red color
algebra-1-common-core-answers-chapter-12-data-analysis-and-probability-exercise-12-8 1 1lc
algebra-1-common-core-answers-chapter-12-data-analysis-and-probability-exercise-12-8 1 1lc1
algebra-1-common-core-answers-chapter-12-data-analysis-and-probability-exercise-12-8 1 1lc2
algebra-1-common-core-answers-chapter-12-data-analysis-and-probability-exercise-12-8 1 1lc3
algebra-1-common-core-answers-chapter-12-data-analysis-and-probability-exercise-12-8 1 1lc4
algebra-1-common-core-answers-chapter-12-data-analysis-and-probability-exercise-12-8 1 1lc5
algebra-1-common-core-answers-chapter-12-data-analysis-and-probability-exercise-12-8 1 1lc6

Chapter 12 Data Analysis and Probability Exercise 12.8 2CB
algebra-1-common-core-answers-chapter-12-data-analysis-and-probability-exercise-12-8 2cb
algebra-1-common-core-answers-chapter-12-data-analysis-and-probability-exercise-12-8 2cb1

Chapter 12 Data Analysis and Probability Exercise 12.8 2LC
algebra-1-common-core-answers-chapter-12-data-analysis-and-probability-exercise-12-8 1 2lc
algebra-1-common-core-answers-chapter-12-data-analysis-and-probability-exercise-12-8 1 2lc1
algebra-1-common-core-answers-chapter-12-data-analysis-and-probability-exercise-12-8 1 2lc2

Chapter 12 Data Analysis and Probability Exercise 12.8 3CB
algebra-1-common-core-answers-chapter-12-data-analysis-and-probability-exercise-12-8 3cb
algebra-1-common-core-answers-chapter-12-data-analysis-and-probability-exercise-12-8 3cb1

Chapter 12 Data Analysis and Probability Exercise 12.8 3LC
Consider five cards: in which 3 cards are yellow color and two cards are red color Out 013 yellow 2 cards are mark with number 5 and 10. and one card is mark with letter B. Out of 2 red card one card mark with letter D. and other card is number card.
Therefore, 3 cards are number cards, one is red color and other two are yellow color Two cards are letter cards one is yellow color and other is red color.
algebra-1-common-core-answers-chapter-12-data-analysis-and-probability-exercise-12-8 1 3lc
algebra-1-common-core-answers-chapter-12-data-analysis-and-probability-exercise-12-8 1 3lc1
algebra-1-common-core-answers-chapter-12-data-analysis-and-probability-exercise-12-8 1 3lc2

Chapter 12 Data Analysis and Probability Exercise 12.8 4CB
algebra-1-common-core-answers-chapter-12-data-analysis-and-probability-exercise-12-8 4cb
algebra-1-common-core-answers-chapter-12-data-analysis-and-probability-exercise-12-8 4cb1

Chapter 12 Data Analysis and Probability Exercise 12.8 4LC
First, define the compound event, and then overlapping events.
Compound event: If an event consist two or more events, they are combined with the word arid or the word or.
Overlapping events: In the two or more events, if at least one event is common in each events. The example of compound event, composed of two overlapping events when you spin a spinner with integers from 1 to 28 is: The spinning numbers on spinner which is multiple of both 2 and 3. The number which is multiple of both 2 and 3 is 6. which comes when spinner is spinning and lies between the integers 1 to 8

Chapter 12 Data Analysis and Probability Exercise 12.8 5CB
algebra-1-common-core-answers-chapter-12-data-analysis-and-probability-exercise-12-8 5cb
algebra-1-common-core-answers-chapter-12-data-analysis-and-probability-exercise-12-8 5cb1
algebra-1-common-core-answers-chapter-12-data-analysis-and-probability-exercise-12-8 5cb2
algebra-1-common-core-answers-chapter-12-data-analysis-and-probability-exercise-12-8 5cb3

Chapter 12 Data Analysis and Probability Exercise 12.8 5LC
The event and its compound event are mutually exclusive.
First define the mutually exclusive and complements of events, then explain whether an event and its complements are mutually exclusive. Mutually exclusive event: Two events are said to be mutually exclusive if the outcomes both event are not common Complement of an event consist all the outcomes of the sample space that are not in the event. To explain an event and its complement are mutually exclusive. consider an example of thronging a cube contain 6 faces are number from I to 6 Thronging a cube coming even number on its face, the complement of even number in is odd number of in the face of cube. Both are mutually exclusive events, since at time only one number is seen in the face of cube, it is either even or odd. Therefore, the even number on the face of cube and its complement odd number on the face of cube are mutually exclusive events.

Chapter 12 Data Analysis and Probability Exercise 12.8 6CB
algebra-1-common-core-answers-chapter-12-data-analysis-and-probability-exercise-12-8 6cb
algebra-1-common-core-answers-chapter-12-data-analysis-and-probability-exercise-12-8 6cb1
algebra-1-common-core-answers-chapter-12-data-analysis-and-probability-exercise-12-8 6cb2
algebra-1-common-core-answers-chapter-12-data-analysis-and-probability-exercise-12-8 6cb3

Chapter 12 Data Analysis and Probability Exercise 12.8 6LC
First define the independent event:
Independent Event: Two events are said to be independent, if the occurrence of first event does not affect the probability of the second event
Example: A cube contains 6 faces are number from 1 to 6. Thronging a cube coming even number on its face or odd number on its face are independent event. because the occurrence of even number on the face of cube does not affect the probability of odd number on the face of cube.

Chapter 12 Data Analysis and Probability Exercise 12.8 7CB
algebra-1-common-core-answers-chapter-12-data-analysis-and-probability-exercise-12-8 7cb
algebra-1-common-core-answers-chapter-12-data-analysis-and-probability-exercise-12-8 7cb1

Chapter 12 Data Analysis and Probability Exercise 12.8 7LC
algebra-1-common-core-answers-chapter-12-data-analysis-and-probability-exercise-12-8 7lc
algebra-1-common-core-answers-chapter-12-data-analysis-and-probability-exercise-12-8 7lc1

Chapter 12 Data Analysis and Probability Exercise 12.8 8CB
algebra-1-common-core-answers-chapter-12-data-analysis-and-probability-exercise-12-8 8cb
algebra-1-common-core-answers-chapter-12-data-analysis-and-probability-exercise-12-8 8cb1
algebra-1-common-core-answers-chapter-12-data-analysis-and-probability-exercise-12-8 8cb2
algebra-1-common-core-answers-chapter-12-data-analysis-and-probability-exercise-12-8 8cb3
algebra-1-common-core-answers-chapter-12-data-analysis-and-probability-exercise-12-8 8cb4

Chapter 12 Data Analysis and Probability Exercise 12.8 8E
algebra-1-common-core-answers-chapter-12-data-analysis-and-probability-exercise-12-8 8e
algebra-1-common-core-answers-chapter-12-data-analysis-and-probability-exercise-12-8 8e1
algebra-1-common-core-answers-chapter-12-data-analysis-and-probability-exercise-12-8 8e2

Chapter 12 Data Analysis and Probability Exercise 12.8 9CB
algebra-1-common-core-answers-chapter-12-data-analysis-and-probability-exercise-12-8 9cb
algebra-1-common-core-answers-chapter-12-data-analysis-and-probability-exercise-12-8 9cb1

Chapter 12 Data Analysis and Probability Exercise 12.8 9E
Consider spin of a spinner A spinner is divided into 10 equal sections each section is mark with unique number with Ito 10. the number mark in one section. not repeated with other section number with 1 to & The sections mark with number 1. 2. 8. 9. and 10 are colored with blue, and the section mark with numbers 3. 4. 5. 6. and J are colored with red. That is five sections are colored with blue and five sections are colored with red
algebra-1-common-core-answers-chapter-12-data-analysis-and-probability-exercise-12-8 9e
algebra-1-common-core-answers-chapter-12-data-analysis-and-probability-exercise-12-8 9e1

Chapter 12 Data Analysis and Probability Exercise 12.8 10CB
algebra-1-common-core-answers-chapter-12-data-analysis-and-probability-exercise-12-8 10cb
algebra-1-common-core-answers-chapter-12-data-analysis-and-probability-exercise-12-8 10cb1

Chapter 12 Data Analysis and Probability Exercise 12.8 10E
Consider spin of a spinner A spinner is divided into lo equal sections each section is mark with unique number with 1 to 10, the number mark in one section, not repeated with other section number with I to 6. The sections mark with number 1. 2. 8. 9. and 10 are colored with blue, and the section mark with numbers 3. 4. 5. 6. and 7 are colored with red. That is five sections are colored with blue and five sections are colored with red.
algebra-1-common-core-answers-chapter-12-data-analysis-and-probability-exercise-12-8 10e
algebra-1-common-core-answers-chapter-12-data-analysis-and-probability-exercise-12-8 10e1

Chapter 12 Data Analysis and Probability Exercise 12.8 11CB
algebra-1-common-core-answers-chapter-12-data-analysis-and-probability-exercise-12-8 11cb
algebra-1-common-core-answers-chapter-12-data-analysis-and-probability-exercise-12-8 11cb1

Chapter 12 Data Analysis and Probability Exercise 12.8 11E
algebra-1-common-core-answers-chapter-12-data-analysis-and-probability-exercise-12-8 11e
algebra-1-common-core-answers-chapter-12-data-analysis-and-probability-exercise-12-8 11e1
algebra-1-common-core-answers-chapter-12-data-analysis-and-probability-exercise-12-8 11e2

Chapter 12 Data Analysis and Probability Exercise 12.8 12CB
algebra-1-common-core-answers-chapter-12-data-analysis-and-probability-exercise-12-8 12cb
algebra-1-common-core-answers-chapter-12-data-analysis-and-probability-exercise-12-8 12cb1

Chapter 12 Data Analysis and Probability Exercise 12.8 12E
algebra-1-common-core-answers-chapter-12-data-analysis-and-probability-exercise-12-8 12e
algebra-1-common-core-answers-chapter-12-data-analysis-and-probability-exercise-12-8 12e1
algebra-1-common-core-answers-chapter-12-data-analysis-and-probability-exercise-12-8 12e2

Chapter 12 Data Analysis and Probability Exercise 12.8 13CB
Consider the statement given in the question:
The required tree diagram has been drawn below using the information given in the question:
As. y is also included, so the total outcome for the last letter = 6
And, the total number of alphabets = 26
algebra-1-common-core-answers-chapter-12-data-analysis-and-probability-exercise-12-8 13cb
algebra-1-common-core-answers-chapter-12-data-analysis-and-probability-exercise-12-8 13cb1
algebra-1-common-core-answers-chapter-12-data-analysis-and-probability-exercise-12-8 13cb2
algebra-1-common-core-answers-chapter-12-data-analysis-and-probability-exercise-12-8 13cb3

Chapter 12 Data Analysis and Probability Exercise 12.8 13E
algebra-1-common-core-answers-chapter-12-data-analysis-and-probability-exercise-12-8 13e
algebra-1-common-core-answers-chapter-12-data-analysis-and-probability-exercise-12-8 13e1
algebra-1-common-core-answers-chapter-12-data-analysis-and-probability-exercise-12-8 13e2

Chapter 12 Data Analysis and Probability Exercise 12.8 14E
algebra-1-common-core-answers-chapter-12-data-analysis-and-probability-exercise-12-8 14e
algebra-1-common-core-answers-chapter-12-data-analysis-and-probability-exercise-12-8 14e1

Chapter 12 Data Analysis and Probability Exercise 12.8 15E
algebra-1-common-core-answers-chapter-12-data-analysis-and-probability-exercise-12-8 15e
algebra-1-common-core-answers-chapter-12-data-analysis-and-probability-exercise-12-8 15e1
algebra-1-common-core-answers-chapter-12-data-analysis-and-probability-exercise-12-8 15e2

Chapter 12 Data Analysis and Probability Exercise 12.8 16E
algebra-1-common-core-answers-chapter-12-data-analysis-and-probability-exercise-12-8 16e
algebra-1-common-core-answers-chapter-12-data-analysis-and-probability-exercise-12-8 16e1

Chapter 12 Data Analysis and Probability Exercise 12.8 17E
Consider the following statement,
You roll a blue number cube and a green number cube.
To find the probability P (blue even and green even):
algebra-1-common-core-answers-chapter-12-data-analysis-and-probability-exercise-12-8 17e
algebra-1-common-core-answers-chapter-12-data-analysis-and-probability-exercise-12-8 17e1

Chapter 12 Data Analysis and Probability Exercise 12.8 18E
algebra-1-common-core-answers-chapter-12-data-analysis-and-probability-exercise-12-8 18e
algebra-1-common-core-answers-chapter-12-data-analysis-and-probability-exercise-12-8 18e1

Chapter 12 Data Analysis and Probability Exercise 12.8 19E
algebra-1-common-core-answers-chapter-12-data-analysis-and-probability-exercise-12-8 19e
algebra-1-common-core-answers-chapter-12-data-analysis-and-probability-exercise-12-8 19e1

Chapter 12 Data Analysis and Probability Exercise 12.8 20E
algebra-1-common-core-answers-chapter-12-data-analysis-and-probability-exercise-12-8 20e
algebra-1-common-core-answers-chapter-12-data-analysis-and-probability-exercise-12-8 20e1

Chapter 12 Data Analysis and Probability Exercise 12.8 21E
algebra-1-common-core-answers-chapter-12-data-analysis-and-probability-exercise-12-8 21e
algebra-1-common-core-answers-chapter-12-data-analysis-and-probability-exercise-12-8 21e1
algebra-1-common-core-answers-chapter-12-data-analysis-and-probability-exercise-12-8 21e2

Chapter 12 Data Analysis and Probability Exercise 12.8 22E
algebra-1-common-core-answers-chapter-12-data-analysis-and-probability-exercise-12-8 22e
algebra-1-common-core-answers-chapter-12-data-analysis-and-probability-exercise-12-8 22e1
algebra-1-common-core-answers-chapter-12-data-analysis-and-probability-exercise-12-8 22e2

Chapter 12 Data Analysis and Probability Exercise 12.8 23E
algebra-1-common-core-answers-chapter-12-data-analysis-and-probability-exercise-12-8 23e
algebra-1-common-core-answers-chapter-12-data-analysis-and-probability-exercise-12-8 23e1
algebra-1-common-core-answers-chapter-12-data-analysis-and-probability-exercise-12-8 23e2

Chapter 12 Data Analysis and Probability Exercise 12.8 24E
algebra-1-common-core-answers-chapter-12-data-analysis-and-probability-exercise-12-8 24e
algebra-1-common-core-answers-chapter-12-data-analysis-and-probability-exercise-12-8 24e1
algebra-1-common-core-answers-chapter-12-data-analysis-and-probability-exercise-12-8 24e2

Chapter 12 Data Analysis and Probability Exercise 12.8 25E
algebra-1-common-core-answers-chapter-12-data-analysis-and-probability-exercise-12-8 25e
algebra-1-common-core-answers-chapter-12-data-analysis-and-probability-exercise-12-8 25e1
algebra-1-common-core-answers-chapter-12-data-analysis-and-probability-exercise-12-8 25e2

Chapter 12 Data Analysis and Probability Exercise 12.8 26E
algebra-1-common-core-answers-chapter-12-data-analysis-and-probability-exercise-12-8 26e
algebra-1-common-core-answers-chapter-12-data-analysis-and-probability-exercise-12-8 26e1
algebra-1-common-core-answers-chapter-12-data-analysis-and-probability-exercise-12-8 26e2

Chapter 12 Data Analysis and Probability Exercise 12.8 27E
algebra-1-common-core-answers-chapter-12-data-analysis-and-probability-exercise-12-8 27e
algebra-1-common-core-answers-chapter-12-data-analysis-and-probability-exercise-12-8 27e1
algebra-1-common-core-answers-chapter-12-data-analysis-and-probability-exercise-12-8 27e2
algebra-1-common-core-answers-chapter-12-data-analysis-and-probability-exercise-12-8 27e3

Chapter 12 Data Analysis and Probability Exercise 12.8 28E
algebra-1-common-core-answers-chapter-12-data-analysis-and-probability-exercise-12-8 28e
algebra-1-common-core-answers-chapter-12-data-analysis-and-probability-exercise-12-8 28e1
algebra-1-common-core-answers-chapter-12-data-analysis-and-probability-exercise-12-8 28e2
algebra-1-common-core-answers-chapter-12-data-analysis-and-probability-exercise-12-8 28e3

Chapter 12 Data Analysis and Probability Exercise 12.8 29E
algebra-1-common-core-answers-chapter-12-data-analysis-and-probability-exercise-12-8 29e
algebra-1-common-core-answers-chapter-12-data-analysis-and-probability-exercise-12-8 29e1
algebra-1-common-core-answers-chapter-12-data-analysis-and-probability-exercise-12-8 29e2
algebra-1-common-core-answers-chapter-12-data-analysis-and-probability-exercise-12-8 29e3

Chapter 12 Data Analysis and Probability Exercise 12.8 30E
algebra-1-common-core-answers-chapter-12-data-analysis-and-probability-exercise-12-8 30e
algebra-1-common-core-answers-chapter-12-data-analysis-and-probability-exercise-12-8 30e1
algebra-1-common-core-answers-chapter-12-data-analysis-and-probability-exercise-12-8 30e2

Chapter 12 Data Analysis and Probability Exercise 12.8 31E
algebra-1-common-core-answers-chapter-12-data-analysis-and-probability-exercise-12-8 31e
algebra-1-common-core-answers-chapter-12-data-analysis-and-probability-exercise-12-8 31e1
algebra-1-common-core-answers-chapter-12-data-analysis-and-probability-exercise-12-8 31e2

Chapter 12 Data Analysis and Probability Exercise 12.8 32E
algebra-1-common-core-answers-chapter-12-data-analysis-and-probability-exercise-12-8 32e
algebra-1-common-core-answers-chapter-12-data-analysis-and-probability-exercise-12-8 32e1
algebra-1-common-core-answers-chapter-12-data-analysis-and-probability-exercise-12-8 32e2
algebra-1-common-core-answers-chapter-12-data-analysis-and-probability-exercise-12-8 32e3
algebra-1-common-core-answers-chapter-12-data-analysis-and-probability-exercise-12-8 32e4

Chapter 12 Data Analysis and Probability Exercise 12.8 33E
Consider the following data:

  • In a set of nine coins 3 nickel. 3 dime, 2 penny. and one quarter
  • One coin is picked randomly from set of coins
  • Second coin is picked without replacing first

Objective is to find the probability P(quarter after quarter). Here, the second coin is picked without replacing the first So, the number of coins for second choice is less than one. This means that, to pick the first coin is affecting the probability to pick the second coin, so both the events are dependent.
algebra-1-common-core-answers-chapter-12-data-analysis-and-probability-exercise-12-8 33e
algebra-1-common-core-answers-chapter-12-data-analysis-and-probability-exercise-12-8 33e1
algebra-1-common-core-answers-chapter-12-data-analysis-and-probability-exercise-12-8 33e2
algebra-1-common-core-answers-chapter-12-data-analysis-and-probability-exercise-12-8 33e3

Chapter 12 Data Analysis and Probability Exercise 12.8 34E
Consider the following data:

  • There are total 5 friends, they are: You, T. and 3 other friends.
  • Every day one name is chosen from a hat contains these 5 friends names.

Objective is to find the probability that you are chosen on Monday and T is chosen on Tuesday.
This can be mathematically expressed as find the probability P(You then T).
Total there are 5 friends including you and T
To select your name first then T are dependent events. because to select first event affect the probability of second events.
algebra-1-common-core-answers-chapter-12-data-analysis-and-probability-exercise-12-8 34e
algebra-1-common-core-answers-chapter-12-data-analysis-and-probability-exercise-12-8 34e1
algebra-1-common-core-answers-chapter-12-data-analysis-and-probability-exercise-12-8 34e2
algebra-1-common-core-answers-chapter-12-data-analysis-and-probability-exercise-12-8 34e3

Chapter 12 Data Analysis and Probability Exercise 12.8 35E
Consider the following data:

  • A new drink samples contains 5 citrus drinks. 3 apple drinks, and 3 raspberries drink.
  • In total. there are 11 drinks.

Objective is to find the probability that an apple drink and then a citrus drink are handed out.
This can be mathematically expressed as:
Find the probability P (apple drink then citrus drink).
To hand out apple drinks then citrus drink are dependent events: because when a apple drink is handed out then the number of drinks is one less than the previous drinks. So the outcomes of first event affect the probability of second event.
algebra-1-common-core-answers-chapter-12-data-analysis-and-probability-exercise-12-8 35e
algebra-1-common-core-answers-chapter-12-data-analysis-and-probability-exercise-12-8 35e1
algebra-1-common-core-answers-chapter-12-data-analysis-and-probability-exercise-12-8 35e2

Chapter 12 Data Analysis and Probability Exercise 12.8 36E
Consider the following events:

  • Event 1: Toss a penny.
  • Event 2: Then toss a nickel

Objective is to determine whether the two events are dependent or independent.
Dependent events: If the probability of second event is affected by the occurrence of first event, then the two events are said to be dependent. Independent events If the probability of second event does not affected by the occurrence of first event, then the two events are said to be independent Here, if one toss a penny. then coming any one face out of two faces on the penny. does not affect the coming any faces out of two faces on nickel. This means. the occurrence of first event that is tossing a penny does not affect the probability of the second event that is the probability of nickel So. tossing penny and nickel are gives the different outcome. Therefore, toss a Penny and then toss a nickel are independent events.

Chapter 12 Data Analysis and Probability Exercise 12.8 37E
Consider the following events:

  • Event 1: Pick a name from a hat
  • Event 2: without replacement pick a different name is dependent event

Objective is to determine whether the two events are dependent or independent.
Dependent events: If the probability of second event is affected by the occurrence of first event. then the two events are said to be dependent Independent events If the probability of second event does not affected by the occurrence of first event, then the two events are said to be independent
algebra-1-common-core-answers-chapter-12-data-analysis-and-probability-exercise-12-8 37e

Chapter 12 Data Analysis and Probability Exercise 12.8 38E
Consider the following events:

  • Event 1: Pick a ball from a basket of yellow and pink balls
  • Event 2: Returned the first ball and pick the second one.

Objective is to determine whether the two events are dependent or independent
Dependent events If the probability of second event is affected by the occurrence of first event, then the two events are said to be dependent
Independent events: If the probability of second event does not affected by the occurrence of first event, then the two events are said to be independent Here, pick a ball from a basket of yellow and pink balls. and then retuned back to basket before second ball is drawn. So. the numbers of ball in basket are same as first drawn for the second time Therefore, the occurrence of first event does not affect the probability of the second Thus, pick a ball from a basket of yellow and pink balls. Returned the first ball and pick second is independent event

Chapter 12 Data Analysis and Probability Exercise 12.8 39E
Consider the following events:

  • Event 1: Pick a ball from a basket of yellow and pink balls.
  • Event 2: Returned the first ball and pick the second one

Objective is to determine whether the two events are dependent or independent
Dependent events: If the probability of second event is affected by the occurrence of first event, then the two events are said to be dependent
Examples: Select a card from a pack of card contain 52 cards, first card is not replaced in the pack and second card is drawn from a pack.
Independent events: If the probability of second event does not affected by the occurrence of first event, then the two events are said to be independent Examples Tossing two coins, coming head or tails on first coin does not affect the probability of coming head or tails on second coin Rolling two dice contain the number from I to 6. Coming any number from I to 6 on first dice does not affect the coming any number on the second dice

Chapter 12 Data Analysis and Probability Exercise 12.8 40E
Consider the statement given in the question:
Total number of mint is 20 + 80 = 1oo
Let the green mint be x
So. the pink mint is 8O—x
algebra-1-common-core-answers-chapter-12-data-analysis-and-probability-exercise-12-8 40e
algebra-1-common-core-answers-chapter-12-data-analysis-and-probability-exercise-12-8 40e1

Chapter 12 Data Analysis and Probability Exercise 12.8 41E
algebra-1-common-core-answers-chapter-12-data-analysis-and-probability-exercise-12-8 41e
algebra-1-common-core-answers-chapter-12-data-analysis-and-probability-exercise-12-8 41e1
algebra-1-common-core-answers-chapter-12-data-analysis-and-probability-exercise-12-8 41e2

Chapter 12 Data Analysis and Probability Exercise 12.8 42E
algebra-1-common-core-answers-chapter-12-data-analysis-and-probability-exercise-12-8 42e

Chapter 12 Data Analysis and Probability Exercise 12.8 43E
algebra-1-common-core-answers-chapter-12-data-analysis-and-probability-exercise-12-8 43e
algebra-1-common-core-answers-chapter-12-data-analysis-and-probability-exercise-12-8 43e1
algebra-1-common-core-answers-chapter-12-data-analysis-and-probability-exercise-12-8 43e2
algebra-1-common-core-answers-chapter-12-data-analysis-and-probability-exercise-12-8 43e3

Chapter 12 Data Analysis and Probability Exercise 12.8 44E
algebra-1-common-core-answers-chapter-12-data-analysis-and-probability-exercise-12-8 44e
algebra-1-common-core-answers-chapter-12-data-analysis-and-probability-exercise-12-8 44e1
algebra-1-common-core-answers-chapter-12-data-analysis-and-probability-exercise-12-8 44e2
algebra-1-common-core-answers-chapter-12-data-analysis-and-probability-exercise-12-8 44e3
algebra-1-common-core-answers-chapter-12-data-analysis-and-probability-exercise-12-8 44e4

Chapter 12 Data Analysis and Probability Exercise 12.8 45E
algebra-1-common-core-answers-chapter-12-data-analysis-and-probability-exercise-12-8 45e
algebra-1-common-core-answers-chapter-12-data-analysis-and-probability-exercise-12-8 45e1
algebra-1-common-core-answers-chapter-12-data-analysis-and-probability-exercise-12-8 45e2

Chapter 12 Data Analysis and Probability Exercise 12.8 46E
algebra-1-common-core-answers-chapter-12-data-analysis-and-probability-exercise-12-8 46e

Chapter 12 Data Analysis and Probability Exercise 12.8 47E
algebra-1-common-core-answers-chapter-12-data-analysis-and-probability-exercise-12-8 47e

Chapter 12 Data Analysis and Probability Exercise 12.8 48E
Consider the statement given in the question:
For the boys from the wrestling team the cafeteria will not be a good option for them as they require more nutritious food to eat and maintain their diet. But for the homeroom they will prefer the cafeteria more as they are already having healthy food at home so. they will want the cafeteria food products more. Thus, the result will vary for both of them
b.
The question for the pizza favor is given below:
What is your favorite topping on the pizza?
The question about the menu choices that is baised is given below:
Would you prefer a cheese burst pizza or a thin crust pizza?

Chapter 12 Data Analysis and Probability Exercise 12.8 49E
algebra-1-common-core-answers-chapter-12-data-analysis-and-probability-exercise-12-8 49e
algebra-1-common-core-answers-chapter-12-data-analysis-and-probability-exercise-12-8 49e1

Chapter 12 Data Analysis and Probability Exercise 12.8 50E
algebra-1-common-core-answers-chapter-12-data-analysis-and-probability-exercise-12-8 50e
algebra-1-common-core-answers-chapter-12-data-analysis-and-probability-exercise-12-8 50e1

Chapter 12 Data Analysis and Probability Exercise 12.8 51E
algebra-1-common-core-answers-chapter-12-data-analysis-and-probability-exercise-12-8 51e
algebra-1-common-core-answers-chapter-12-data-analysis-and-probability-exercise-12-8 51e1

Chapter 12 Data Analysis and Probability Exercise 12.8 52E
algebra-1-common-core-answers-chapter-12-data-analysis-and-probability-exercise-12-8 52e
algebra-1-common-core-answers-chapter-12-data-analysis-and-probability-exercise-12-8 52e1

Chapter 12 Data Analysis and Probability Exercise 12.8 53E
algebra-1-common-core-answers-chapter-12-data-analysis-and-probability-exercise-12-8 53e

Chapter 12 Data Analysis and Probability Exercise 12.8 54E
algebra-1-common-core-answers-chapter-12-data-analysis-and-probability-exercise-12-8 54e

Chapter 12 Data Analysis and Probability Exercise 12.8 55E
algebra-1-common-core-answers-chapter-12-data-analysis-and-probability-exercise-12-8 55e
algebra-1-common-core-answers-chapter-12-data-analysis-and-probability-exercise-12-8 55e1

Algebra 1 Common Core Answers Chapter 12 Data Analysis and Probability Exercise 12.6

Algebra 1 Common Core Answers Student Edition Grade 8 – 9 Chapter 12 Data Analysis and Probability Exercise 12.6

Algebra 1 Common Core Solutions

Chapter 12 Data Analysis and Probability Exercise 12.6 1LC
algebra-1-common-core-answers-chapter-12-data-analysis-and-probability-exercise-12-6  1lc

Chapter 12 Data Analysis and Probability Exercise 12.6 2LC
algebra-1-common-core-answers-chapter-12-data-analysis-and-probability-exercise-12-6  2lc

Chapter 12 Data Analysis and Probability Exercise 12.6 3LC
algebra-1-common-core-answers-chapter-12-data-analysis-and-probability-exercise-12-6  3lc

Chapter 12 Data Analysis and Probability Exercise 12.6 4LC
algebra-1-common-core-answers-chapter-12-data-analysis-and-probability-exercise-12-6  4lc

Chapter 12 Data Analysis and Probability Exercise 12.6 5LC
algebra-1-common-core-answers-chapter-12-data-analysis-and-probability-exercise-12-6  5lc

Chapter 12 Data Analysis and Probability Exercise 12.6 6LC
algebra-1-common-core-answers-chapter-12-data-analysis-and-probability-exercise-12-6  6lc

Chapter 12 Data Analysis and Probability Exercise 12.6 7LC
The objective is to find the number of outfit that you can make with 6 shirt and 4 pairs of pants. If m and n are two positive integers, and there are m ways to make first selection and n ways to make second selection, then there are in•n ways to make the two selections Put the value 6 for m. and 4 for n.
64=24
Thus, there are 24 outfit you can make with 6 shirt and 4 pairs of pants

Chapter 12 Data Analysis and Probability Exercise 12.6 8LC
The objective is to determine whether permutations or combinations are used to find the possible arrangements 1o students in a line.
Explanation:
Definition of Permutation and Combination:
A permutation is the arrangement of objects in a specific order and a combination is the selection of objects in a specific order By the above definition. permutation are used to find the number of possible arrangement of 10 students in a line.

Chapter 12 Data Analysis and Probability Exercise 12.6 9LC
algebra-1-common-core-answers-chapter-12-data-analysis-and-probability-exercise-12-6  9lc
From the definition of permutation and combination it is clear that. permutation and combination are different In permutation. the order of object is matter while arranging them. but in the combination or selection of object order is not required Therefore. permutation of used to count in situation where order is important. but in combination is used to count in situation where order is not important.

Chapter 12 Data Analysis and Probability Exercise 12.6 10LC
algebra-1-common-core-answers-chapter-12-data-analysis-and-probability-exercise-12-6  10lc

Chapter 12 Data Analysis and Probability Exercise 12.6 11E
algebra-1-common-core-answers-chapter-12-data-analysis-and-probability-exercise-12-6  11e
algebra-1-common-core-answers-chapter-12-data-analysis-and-probability-exercise-12-6  11e1

Chapter 12 Data Analysis and Probability Exercise 12.6 12E
algebra-1-common-core-answers-chapter-12-data-analysis-and-probability-exercise-12-6  12e
(a)
To find the number of routes from A to C, use Multiplication counting Principle.
Now, the diagram indicated that there are two routes from A to B. and there are three routes
from B to C
Multiplication Counting Principle: If there are m ways to make first selection and n ways to make second selection, then there are ;n,, ways to make the selections
So. by using the Multiplication counting principle, put the value 2 for m and 3 for, then get the number of routes from A to C. The number of routes from A to C is given below:
2.3= 6
Therefore, the number of routes from A to C is 6 routes
To find the number of from A to D. use Multiplication counting Principle Now, the diagram indicated that there are two routes from A to B. there are three routes from B to C. and there are two routes from C to D.
Multiplication Counting Principle: If there are m ways to make first selection, n ways to make second selection, and k way to make third selection then there are m.n.k ways to make the selections. So, by using the Multiplication counting principle, put the value 2 for m. 3 for n, and 2 for k, then get the number of routs from A to D. The number of routes from A to D is given below:
2.3.2=12
Therefore, the number of routes from A to D is 12 routes.

Chapter 12 Data Analysis and Probability Exercise 12.6 13E
Let the number of skaters are participated in the final of ice-skating competition be .
To find the different orders are possible for the final program, use the concept of permutations.
Since there are 10 skaters in the final, so, there are 10 choices for the first skaters, 9 choices for the second, 8 choice for the third skaters, 7 choice for the fourth skaters, 6 choice for the fifth skaters, 5 choices for the sixth skaters, 4 choices for the seventh skaters, 3 choices for the eighth skaters, 2 choice for the ninth skaters, and one choice for the tenth skaters.
Multiply the number of ways to make the total number of different possible orders.
So, the different orders are possible for the final program can be calculated as follows:
10.9.8.7.6.5.4.3.2.1 = 3,628,800
Therefore, the total number of different possible orders is 3,628,800.

Chapter 12 Data Analysis and Probability Exercise 12.6 14E
algebra-1-common-core-answers-chapter-12-data-analysis-and-probability-exercise-12-6  14e

Chapter 12 Data Analysis and Probability Exercise 12.6 15E
algebra-1-common-core-answers-chapter-12-data-analysis-and-probability-exercise-12-6  15e

Chapter 12 Data Analysis and Probability Exercise 12.6 16E
algebra-1-common-core-answers-chapter-12-data-analysis-and-probability-exercise-12-6  16e
algebra-1-common-core-answers-chapter-12-data-analysis-and-probability-exercise-12-6  16e1

Chapter 12 Data Analysis and Probability Exercise 12.6 17E
algebra-1-common-core-answers-chapter-12-data-analysis-and-probability-exercise-12-6  17e
algebra-1-common-core-answers-chapter-12-data-analysis-and-probability-exercise-12-6  17e1

Chapter 12 Data Analysis and Probability Exercise 12.6 18E
algebra-1-common-core-answers-chapter-12-data-analysis-and-probability-exercise-12-6  18e
algebra-1-common-core-answers-chapter-12-data-analysis-and-probability-exercise-12-6  18e1

Chapter 12 Data Analysis and Probability Exercise 12.6 19E
algebra-1-common-core-answers-chapter-12-data-analysis-and-probability-exercise-12-6  19e
algebra-1-common-core-answers-chapter-12-data-analysis-and-probability-exercise-12-6  19e1

Chapter 12 Data Analysis and Probability Exercise 12.6 20E
algebra-1-common-core-answers-chapter-12-data-analysis-and-probability-exercise-12-6  20e
algebra-1-common-core-answers-chapter-12-data-analysis-and-probability-exercise-12-6  20e1

Chapter 12 Data Analysis and Probability Exercise 12.6 21E
algebra-1-common-core-answers-chapter-12-data-analysis-and-probability-exercise-12-6  21e
algebra-1-common-core-answers-chapter-12-data-analysis-and-probability-exercise-12-6  21e1

Chapter 12 Data Analysis and Probability Exercise 12.6 22E
algebra-1-common-core-answers-chapter-12-data-analysis-and-probability-exercise-12-6  22e
algebra-1-common-core-answers-chapter-12-data-analysis-and-probability-exercise-12-6  22e1

Chapter 12 Data Analysis and Probability Exercise 12.6 23E
algebra-1-common-core-answers-chapter-12-data-analysis-and-probability-exercise-12-6  23e
algebra-1-common-core-answers-chapter-12-data-analysis-and-probability-exercise-12-6  23e1

Chapter 12 Data Analysis and Probability Exercise 12.6 24E
algebra-1-common-core-answers-chapter-12-data-analysis-and-probability-exercise-12-6  24e
algebra-1-common-core-answers-chapter-12-data-analysis-and-probability-exercise-12-6  24e1

Chapter 12 Data Analysis and Probability Exercise 12.6 25E
algebra-1-common-core-answers-chapter-12-data-analysis-and-probability-exercise-12-6  25e
algebra-1-common-core-answers-chapter-12-data-analysis-and-probability-exercise-12-6  25e1

Chapter 12 Data Analysis and Probability Exercise 12.6 26E
Let the number of members in a student council is 24 members
Let the number of members selected for a committee be 3 students
algebra-1-common-core-answers-chapter-12-data-analysis-and-probability-exercise-12-6  26e

Chapter 12 Data Analysis and Probability Exercise 12.6 27E
algebra-1-common-core-answers-chapter-12-data-analysis-and-probability-exercise-12-6  27e
algebra-1-common-core-answers-chapter-12-data-analysis-and-probability-exercise-12-6  27e1

Chapter 12 Data Analysis and Probability Exercise 12.6 28E
algebra-1-common-core-answers-chapter-12-data-analysis-and-probability-exercise-12-6  28e
algebra-1-common-core-answers-chapter-12-data-analysis-and-probability-exercise-12-6  28e1

Chapter 12 Data Analysis and Probability Exercise 12.6 29E
algebra-1-common-core-answers-chapter-12-data-analysis-and-probability-exercise-12-6  29e
algebra-1-common-core-answers-chapter-12-data-analysis-and-probability-exercise-12-6  29e1

Chapter 12 Data Analysis and Probability Exercise 12.6 30E
algebra-1-common-core-answers-chapter-12-data-analysis-and-probability-exercise-12-6  30e
algebra-1-common-core-answers-chapter-12-data-analysis-and-probability-exercise-12-6  30e1

Chapter 12 Data Analysis and Probability Exercise 12.6 31E
algebra-1-common-core-answers-chapter-12-data-analysis-and-probability-exercise-12-6  31e
algebra-1-common-core-answers-chapter-12-data-analysis-and-probability-exercise-12-6  31e1

Chapter 12 Data Analysis and Probability Exercise 12.6 32E
algebra-1-common-core-answers-chapter-12-data-analysis-and-probability-exercise-12-6  32e
algebra-1-common-core-answers-chapter-12-data-analysis-and-probability-exercise-12-6  32e1

Chapter 12 Data Analysis and Probability Exercise 12.6 33E
algebra-1-common-core-answers-chapter-12-data-analysis-and-probability-exercise-12-6  33e
algebra-1-common-core-answers-chapter-12-data-analysis-and-probability-exercise-12-6  33e1

Chapter 12 Data Analysis and Probability Exercise 12.6 34E
algebra-1-common-core-answers-chapter-12-data-analysis-and-probability-exercise-12-6  34e
algebra-1-common-core-answers-chapter-12-data-analysis-and-probability-exercise-12-6  34e1

Chapter 12 Data Analysis and Probability Exercise 12.6 35E
algebra-1-common-core-answers-chapter-12-data-analysis-and-probability-exercise-12-6  35e
algebra-1-common-core-answers-chapter-12-data-analysis-and-probability-exercise-12-6  35e1

Chapter 12 Data Analysis and Probability Exercise 12.6 36E
algebra-1-common-core-answers-chapter-12-data-analysis-and-probability-exercise-12-6  36e
algebra-1-common-core-answers-chapter-12-data-analysis-and-probability-exercise-12-6  36e1

Chapter 12 Data Analysis and Probability Exercise 12.6 37E
algebra-1-common-core-answers-chapter-12-data-analysis-and-probability-exercise-12-6  37e
algebra-1-common-core-answers-chapter-12-data-analysis-and-probability-exercise-12-6  37e1

Chapter 12 Data Analysis and Probability Exercise 12.6 38E
algebra-1-common-core-answers-chapter-12-data-analysis-and-probability-exercise-12-6  38e
algebra-1-common-core-answers-chapter-12-data-analysis-and-probability-exercise-12-6  38e1

Chapter 12 Data Analysis and Probability Exercise 12.6 39E
algebra-1-common-core-answers-chapter-12-data-analysis-and-probability-exercise-12-6  39e
algebra-1-common-core-answers-chapter-12-data-analysis-and-probability-exercise-12-6  39e1

Chapter 12 Data Analysis and Probability Exercise 12.6 40E
algebra-1-common-core-answers-chapter-12-data-analysis-and-probability-exercise-12-6  40e
algebra-1-common-core-answers-chapter-12-data-analysis-and-probability-exercise-12-6  40e1
algebra-1-common-core-answers-chapter-12-data-analysis-and-probability-exercise-12-6  40e2

Chapter 12 Data Analysis and Probability Exercise 12.6 41E
algebra-1-common-core-answers-chapter-12-data-analysis-and-probability-exercise-12-6  41e
algebra-1-common-core-answers-chapter-12-data-analysis-and-probability-exercise-12-6  41e1
algebra-1-common-core-answers-chapter-12-data-analysis-and-probability-exercise-12-6  41e2

Chapter 12 Data Analysis and Probability Exercise 12.6 42E
algebra-1-common-core-answers-chapter-12-data-analysis-and-probability-exercise-12-6  42e
algebra-1-common-core-answers-chapter-12-data-analysis-and-probability-exercise-12-6  42e1

Chapter 12 Data Analysis and Probability Exercise 12.6 43E
algebra-1-common-core-answers-chapter-12-data-analysis-and-probability-exercise-12-6  43e
algebra-1-common-core-answers-chapter-12-data-analysis-and-probability-exercise-12-6  43e1

Chapter 12 Data Analysis and Probability Exercise 12.6 44E
algebra-1-common-core-answers-chapter-12-data-analysis-and-probability-exercise-12-6  44e
algebra-1-common-core-answers-chapter-12-data-analysis-and-probability-exercise-12-6  44e1
algebra-1-common-core-answers-chapter-12-data-analysis-and-probability-exercise-12-6  44e2

Chapter 12 Data Analysis and Probability Exercise 12.6 45E
algebra-1-common-core-answers-chapter-12-data-analysis-and-probability-exercise-12-6  45e

Chapter 12 Data Analysis and Probability Exercise 12.6 46E
algebra-1-common-core-answers-chapter-12-data-analysis-and-probability-exercise-12-6  46e
algebra-1-common-core-answers-chapter-12-data-analysis-and-probability-exercise-12-6  46e1
algebra-1-common-core-answers-chapter-12-data-analysis-and-probability-exercise-12-6  46e2
algebra-1-common-core-answers-chapter-12-data-analysis-and-probability-exercise-12-6  46e3

Chapter 12 Data Analysis and Probability Exercise 12.6 47E
algebra-1-common-core-answers-chapter-12-data-analysis-and-probability-exercise-12-6  47e
Creating a password. to use the four letters from name is not a good idea. Because, only 24 permutations are there, so it is not difficult to make 24 arrangements to Lena name, if any bode try it can find the password.

Chapter 12 Data Analysis and Probability Exercise 12.6 48E
algebra-1-common-core-answers-chapter-12-data-analysis-and-probability-exercise-12-6  48e

Chapter 12 Data Analysis and Probability Exercise 12.6 49E
algebra-1-common-core-answers-chapter-12-data-analysis-and-probability-exercise-12-6  49e

Chapter 12 Data Analysis and Probability Exercise 12.6 50E
algebra-1-common-core-answers-chapter-12-data-analysis-and-probability-exercise-12-6  50e

Chapter 12 Data Analysis and Probability Exercise 12.6 51E
algebra-1-common-core-answers-chapter-12-data-analysis-and-probability-exercise-12-6  51e
algebra-1-common-core-answers-chapter-12-data-analysis-and-probability-exercise-12-6  51e1

Chapter 12 Data Analysis and Probability Exercise 12.6 52E
algebra-1-common-core-answers-chapter-12-data-analysis-and-probability-exercise-12-6  52e
algebra-1-common-core-answers-chapter-12-data-analysis-and-probability-exercise-12-6  52e1

Chapter 12 Data Analysis and Probability Exercise 12.6 53E
algebra-1-common-core-answers-chapter-12-data-analysis-and-probability-exercise-12-6  53e
algebra-1-common-core-answers-chapter-12-data-analysis-and-probability-exercise-12-6  53e1

Chapter 12 Data Analysis and Probability Exercise 12.6 54E
algebra-1-common-core-answers-chapter-12-data-analysis-and-probability-exercise-12-6  54e

Chapter 12 Data Analysis and Probability Exercise 12.6 55E
algebra-1-common-core-answers-chapter-12-data-analysis-and-probability-exercise-12-6  55e
Let us find the different possible number of call sign for each station in US which begin with
letters W or K followed by 4 letters.
At the first place of the call sign is fixed either W or K.
So. to choose one letters, form 26 letters (A to Z) in 26 ways. which comes after W or K in the call sign. Similarly. to choose one letter from 26 letters (A to Z) in 26 ways which comes at the second place of the call sign after W or K. Choose one letter from 26 letters (A to Z) in 26 ways which comes at the third place of the call sign after W or K and to choose one letter from 26 letters (A to Z) in 26 ways which comes is the last letter of the call sign.
Therefore, the total possible number of ways to select 4 letters out of 26 letters, when repetitions are allowed, to make call sign which begin with either W or K is:
26x26x26x26+26x26x26x26 = 456976÷ 456976
= 913952
Thus, there are 19139521 different calls signs are possible. for each station in US which begin with letters W or K followed by 4 letters.

Chapter 12 Data Analysis and Probability Exercise 12.6 56E
algebra-1-common-core-answers-chapter-12-data-analysis-and-probability-exercise-12-6  56e
algebra-1-common-core-answers-chapter-12-data-analysis-and-probability-exercise-12-6  56e1
algebra-1-common-core-answers-chapter-12-data-analysis-and-probability-exercise-12-6  56e2
algebra-1-common-core-answers-chapter-12-data-analysis-and-probability-exercise-12-6  56e3

Chapter 12 Data Analysis and Probability Exercise 12.6 57E
algebra-1-common-core-answers-chapter-12-data-analysis-and-probability-exercise-12-6  57e
algebra-1-common-core-answers-chapter-12-data-analysis-and-probability-exercise-12-6  57e1
algebra-1-common-core-answers-chapter-12-data-analysis-and-probability-exercise-12-6  57e2
algebra-1-common-core-answers-chapter-12-data-analysis-and-probability-exercise-12-6  57e3

Chapter 12 Data Analysis and Probability Exercise 12.6 58E
algebra-1-common-core-answers-chapter-12-data-analysis-and-probability-exercise-12-6  58e
algebra-1-common-core-answers-chapter-12-data-analysis-and-probability-exercise-12-6  58e1
algebra-1-common-core-answers-chapter-12-data-analysis-and-probability-exercise-12-6  58e2
algebra-1-common-core-answers-chapter-12-data-analysis-and-probability-exercise-12-6  58e3

Chapter 12 Data Analysis and Probability Exercise 12.6 59E
algebra-1-common-core-answers-chapter-12-data-analysis-and-probability-exercise-12-6  59e
algebra-1-common-core-answers-chapter-12-data-analysis-and-probability-exercise-12-6  59e1
algebra-1-common-core-answers-chapter-12-data-analysis-and-probability-exercise-12-6  59e2
algebra-1-common-core-answers-chapter-12-data-analysis-and-probability-exercise-12-6  59e3

Chapter 12 Data Analysis and Probability Exercise 12.6 60E
algebra-1-common-core-answers-chapter-12-data-analysis-and-probability-exercise-12-6  60e
algebra-1-common-core-answers-chapter-12-data-analysis-and-probability-exercise-12-6  60e1
algebra-1-common-core-answers-chapter-12-data-analysis-and-probability-exercise-12-6  60e2
algebra-1-common-core-answers-chapter-12-data-analysis-and-probability-exercise-12-6  60e3
algebra-1-common-core-answers-chapter-12-data-analysis-and-probability-exercise-12-6  60e4

Chapter 12 Data Analysis and Probability Exercise 12.6 61E
algebra-1-common-core-answers-chapter-12-data-analysis-and-probability-exercise-12-6  61e
algebra-1-common-core-answers-chapter-12-data-analysis-and-probability-exercise-12-6  61e1
algebra-1-common-core-answers-chapter-12-data-analysis-and-probability-exercise-12-6  61e2

Chapter 12 Data Analysis and Probability Exercise 12.6 62E
algebra-1-common-core-answers-chapter-12-data-analysis-and-probability-exercise-12-6  62e
algebra-1-common-core-answers-chapter-12-data-analysis-and-probability-exercise-12-6  62e1
algebra-1-common-core-answers-chapter-12-data-analysis-and-probability-exercise-12-6  62e2

Chapter 12 Data Analysis and Probability Exercise 12.6 63E
algebra-1-common-core-answers-chapter-12-data-analysis-and-probability-exercise-12-6  63e
algebra-1-common-core-answers-chapter-12-data-analysis-and-probability-exercise-12-6  63e1
algebra-1-common-core-answers-chapter-12-data-analysis-and-probability-exercise-12-6  63e2

Chapter 12 Data Analysis and Probability Exercise 12.6 64E
algebra-1-common-core-answers-chapter-12-data-analysis-and-probability-exercise-12-6  64e
algebra-1-common-core-answers-chapter-12-data-analysis-and-probability-exercise-12-6  64e1
algebra-1-common-core-answers-chapter-12-data-analysis-and-probability-exercise-12-6  64e2

Chapter 12 Data Analysis and Probability Exercise 12.6 65E
The number of questions in a test is 1o.
The test is to answer total 7 questions, including exactly 4 of the first 6 question
algebra-1-common-core-answers-chapter-12-data-analysis-and-probability-exercise-12-6  65e
algebra-1-common-core-answers-chapter-12-data-analysis-and-probability-exercise-12-6  65e1
algebra-1-common-core-answers-chapter-12-data-analysis-and-probability-exercise-12-6  65e2
algebra-1-common-core-answers-chapter-12-data-analysis-and-probability-exercise-12-6  65e3

Chapter 12 Data Analysis and Probability Exercise 12.6 66E
algebra-1-common-core-answers-chapter-12-data-analysis-and-probability-exercise-12-6  66e
algebra-1-common-core-answers-chapter-12-data-analysis-and-probability-exercise-12-6  66e1

Chapter 12 Data Analysis and Probability Exercise 12.6 67E
algebra-1-common-core-answers-chapter-12-data-analysis-and-probability-exercise-12-6  67e

Chapter 12 Data Analysis and Probability Exercise 12.6 68E
algebra-1-common-core-answers-chapter-12-data-analysis-and-probability-exercise-12-6  68e
algebra-1-common-core-answers-chapter-12-data-analysis-and-probability-exercise-12-6  68e1

Chapter 12 Data Analysis and Probability Exercise 12.6 69E
algebra-1-common-core-answers-chapter-12-data-analysis-and-probability-exercise-12-6  69e

Chapter 12 Data Analysis and Probability Exercise 12.6 70E
Qualitative data: A data is said to qualitative, if it describes the quality that is the category of the data, and cannot measure, or numerical compared and it has no units
The data set of ZIP codes is represented the identification of the areas, hence it is qualitative The data set of ZIP codes describes the category of data and cannot be measured or numerically compared. it also have not units Therefore, the data set of ZIP codes is qualitative.

Chapter 12 Data Analysis and Probability Exercise 12.6 71E
Consider the data set of race times
The objective is to determine whether the data set of race times is quantitative or qualitative
Quantitative data: It measures the quantities of the data and can be describe numerically It has also the units and it can be numerically compared The data set of race times is represented by the numerical values and the race time has the unit in hours. The data set of race time are numerically described (countable number). and also it can be numerically compared So. the race times are quantitative data. Therefore, the data set of race times is quantitative.

Chapter 12 Data Analysis and Probability Exercise 12.6 72E
Consider the data set of heights of people.
The objective is to determine whether the data set of heights of people is quantitative or qualitative
Quantitative data: It measures the quantities of the data and can be describe numerically. It has also the units and it can be numerically compared The data set of heights of people is represented by the numerical value and the height of the people has the unit in cm or meter or feet. The data set of heights of people are numerically described (countable number). and also it can be numerically compared So. the heights of the people are quantitative data Therefore, the data set of heights of people quantitative.

Chapter 12 Data Analysis and Probability Exercise 12.6 73E
Consider the data set of emotions
The objective is to determine whether the data set of emotions is quantitative or qualitative.
Qualitative data: A data is said to qualitative, if it describes a category of the data. describes the quality, and cannot measure, or numerical compared and it has no units The data set of emotions is represented the quality data, since emotion is the attributes of the people. so it is a quality data The data set of emotions describes the category of data and cannot be measured or numerically compared. the emotions have not units Therefore, the data set of emotions is quaIitative.

Chapter 12 Data Analysis and Probability Exercise 12.6 74E
algebra-1-common-core-answers-chapter-12-data-analysis-and-probability-exercise-12-6  74e
algebra-1-common-core-answers-chapter-12-data-analysis-and-probability-exercise-12-6  74e1

Chapter 12 Data Analysis and Probability Exercise 12.6 75E
algebra-1-common-core-answers-chapter-12-data-analysis-and-probability-exercise-12-6  75e
algebra-1-common-core-answers-chapter-12-data-analysis-and-probability-exercise-12-6  75e1

Chapter 12 Data Analysis and Probability Exercise 12.6 76E
algebra-1-common-core-answers-chapter-12-data-analysis-and-probability-exercise-12-6  76e
algebra-1-common-core-answers-chapter-12-data-analysis-and-probability-exercise-12-6  76e1

Chapter 12 Data Analysis and Probability Exercise 12.6 77E
algebra-1-common-core-answers-chapter-12-data-analysis-and-probability-exercise-12-6  77e
algebra-1-common-core-answers-chapter-12-data-analysis-and-probability-exercise-12-6  77e1

Chapter 12 Data Analysis and Probability Exercise 12.6 78E
consider the decimal:
0.32.
The objective is to write the decimal in percent
To convert any decimal as a percent. move the decimal point two places to the right and write the percent sign.
So, 0.32=32%
Therefore, the decimal value 0.32 in Percent is 32% .

Chapter 12 Data Analysis and Probability Exercise 12.6 79E
Consider the decimal:
0.09
The objective is to write the decimal in percent
To convert any decimal as a percent. move the decimal point two places to the right and write the percent sign.
So, 0.09=9%.
Therefore, the decimal value 0.09 in percent is 9% .

Chapter 12 Data Analysis and Probability Exercise 12.6 80E
algebra-1-common-core-answers-chapter-12-data-analysis-and-probability-exercise-12-6  80e

Chapter 12 Data Analysis and Probability Exercise 12.6 81E
algebra-1-common-core-answers-chapter-12-data-analysis-and-probability-exercise-12-6  80e1

Algebra 1 Common Core Answers Chapter 12 Data Analysis and Probability Exercise 12.5

Algebra 1 Common Core Answers Student Edition Grade 8 – 9 Chapter 12 Data Analysis and Probability Exercise 12.5

Algebra 1 Common Core Solutions

Chapter 12 Data Analysis and Probability Exercise 12.5 1CB1
The result of the survey is the representative of the entire school. Since the survey is conducted at the school gym on everybody At the school gym only the students is there who are doing the exercise So. the survey is conducted only those student who are doing the exercise from the student of the entire school. Thus, you have to say that the survey conducted at school gym on everybody represent the survey of entire school

Chapter 12 Data Analysis and Probability Exercise 12.5 1CB2
Consider the table given in the question:
Look for the row of men and the column of martial arts camp. clearly, the men who purchased tickets to martial arts champ = 12
Algebra 1 Common Core Answers Chapter 12 Data Analysis and Probability Exercise 12.5 1cb2
Therefore, the required ratio is 2: 15 and the corresponding percentage is 13.3%

Chapter 12 Data Analysis and Probability Exercise 12.5 1LC
Determine the sampling method for the survey of every tenth students who enter the cafeteria is random, systematic. and stratified The survey is done in every tenth student who enters the cafeteria So. the survey is conducted into fixed number of student, therefore we use the definition of systematic sampling method:
Systematic Sampling method: In this method select any number k at random, and then survey every k person in the sample Put the value k = 10. then by the definition of systematic sampling method, the survey of every tenth students who enter the cafeteria is systematic. Therefore, the surveys on every tenth students who enter the cafeteria are systematic.

Chapter 12 Data Analysis and Probability Exercise 12.5 1MC
Algebra 1 Common Core Answers Chapter 12 Data Analysis and Probability Exercise 12.5 1mcq
Algebra 1 Common Core Answers Chapter 12 Data Analysis and Probability Exercise 12.5 1mcq1

Chapter 12 Data Analysis and Probability Exercise 12.5 2CB1
The survey can also be conducted at each class of the school. and ask every student in the each class who join the gym of the school. “how many hours of exercise do you get every week” The result of the survey is representing the entire school. Thus, the survey conducted in each class in the only those student who join gym is also represent the entire school

Chapter 12 Data Analysis and Probability Exercise 12.5 2CB2
Consider the table given in the question:
Look for the row of men and the column of martial arts camp. clearly, the men who purchased tickets to martial arts champ = 12
Algebra 1 Common Core Answers Chapter 12 Data Analysis and Probability Exercise 12.5 2cb2
Therefore, the required ratio is 4:67 and the corresponding percentage is 5.9%

Chapter 12 Data Analysis and Probability Exercise 12.5 2LC
Determine the sampling method for the survey of drawn student ID numbers out of hat and survey those students is either random, or systematic. or stratified The survey of drawn student ID numbers out of hat So, the use the definition of random sampling method:
Random Sampling method: In this method survey on a population at random, that is survey on the people whose identification marks such as names, ID number are drawn out of a hat and survey those student Therefore, by the definition of random sampling method, to draw the student ID number out of a hat and survey those students is random sampling method.

Chapter 12 Data Analysis and Probability Exercise 12.5 2MCQ
Algebra 1 Common Core Answers Chapter 12 Data Analysis and Probability Exercise 12.5 2mcq
Algebra 1 Common Core Answers Chapter 12 Data Analysis and Probability Exercise 12.5 2mcq1

Chapter 12 Data Analysis and Probability Exercise 12.5 3CB1
Suppose you asked the students, “Do you work out every day like healthy person” Then the result of the survey is change. Because, the data which you are to collected from your survey is qualitative in nature. Qualitative data is description in nature and it has no numerical value. Since the answer of the question is either yes or no. But in our previous survey the data which you are collected from survey is quantitative in nature, since its output represent a numerical values that is the answer of the student is who join the school gym of an exercise is in hours. Therefore. the result of the survey is change.

Chapter 12 Data Analysis and Probability Exercise 12.5 3CB2
Consider the table given in the question:
Look for the row of women and the column of martial arts camp. clearly, the women who purchased tickets to martial arts champ = 86
Algebra 1 Common Core Answers Chapter 12 Data Analysis and Probability Exercise 12.5 3cb2
Therefore. the required ratio is 43:49 and the corresponding percentage is 87.7%

Chapter 12 Data Analysis and Probability Exercise 12.5 3LC
Let us determine the sampling method of survey two students at random from each is random, systematic. and stratified. The survey is done in two students at random in each class, so use the definition of s stratified sampling method;
The stratified sampling method is defined as:
Stratified sampling method: In this method, population is divided into the number of groups. and then random samples are taken from each groups and survey To determine the sampling method on survey of two students at random in each class, use the definition of stratified sampling method Here the population is divided into the number of classes And survey two students at random in each class, therefore the sampling method are stratified.

Chapter 12 Data Analysis and Probability Exercise 12.5 3MCQ
Algebra 1 Common Core Answers Chapter 12 Data Analysis and Probability Exercise 12.5 3mcq
Algebra 1 Common Core Answers Chapter 12 Data Analysis and Probability Exercise 12.5 3mcq1

Chapter 12 Data Analysis and Probability Exercise 12.5 4CB1
Select a topic. “favorite sports” for our survey
In this topic first you have to define four kinds of sports for our survey

  • Football,
  • Tennis.
  • Basketball.
  • Swimming,

During the survey the people have give their opinions.

Chapter 12 Data Analysis and Probability Exercise 12.5 4CB2
Consider the table given in the question:
Look for the row of women and the column of story of love, clearly, the women who purchased tickets to martial arts champ = 25
Algebra 1 Common Core Answers Chapter 12 Data Analysis and Probability Exercise 12.5 4cb2
Therefore, the required ratio is 25 : 103 and the corresponding percentage is 24.2%.

Chapter 12 Data Analysis and Probability Exercise 12.5 4LC
Let us determine the data set of class test score is quantitative or qualitative. The quantitative data is defined as;
Quantitative data: It measures the quantities of the data and can be describe numerically It has also the units and it can be numerically compared. Here data set of class test score are numerically describe, so it has the quantitative data Therefore the data set of the class test score is quantitative.

Chapter 12 Data Analysis and Probability Exercise 12.5 4MCQ
Algebra 1 Common Core Answers Chapter 12 Data Analysis and Probability Exercise 12.5 4mcq
Algebra 1 Common Core Answers Chapter 12 Data Analysis and Probability Exercise 12.5 4mcq1

Chapter 12 Data Analysis and Probability Exercise 12.5 5CB1
During the survey you have to ask the question. “What is your favorite sport”.

  • Football,
  • Tennis,
  • Basketball,
  • Swimming.

The question influences the opinion of the people. Since some people have the choice football and it also like tennis. So, the opinion of the people is influence, during the survey.

Chapter 12 Data Analysis and Probability Exercise 12.5 5CB2
Consider the statement given in the question:
Compare the number of movies watched by men and women in the given table For men. 78>25 and for women, 86>25
Now, from the table given in the question. men like the movie story of love more and the women like the movie martial arts champ more

Chapter 12 Data Analysis and Probability Exercise 12.5 5LC
By the definition of bias question. a question is said to be bias if it contain the assumption which may or may not be true and that reflect the opinion of the answer. Therefore, by the definition of the bias questions, the question “Do you prefer delicious fruit or plain vegetables for a snack food” is bias because it contains the word delicious and plain. which reflect the opinion of the peoples.

Chapter 12 Data Analysis and Probability Exercise 12.5 5MCQ
Algebra 1 Common Core Answers Chapter 12 Data Analysis and Probability Exercise 12.5 5mcq
From the above histogram we see that all the bars are roughly same height. By the definition of uniform histogram. “if all the bars of a histogram are roughly in the same height then histogram is uniform” Thus, the above histogram is uniform.

Chapter 12 Data Analysis and Probability Exercise 12.5 6CB1
Need to study only some people of the groups. which are the representative of that group. Because to do the survey in every person in the group is very time consuming. so you have to conduct a survey to only some person in the group You also make sure that the people on which you conduct he survey is not influence with any situation

Chapter 12 Data Analysis and Probability Exercise 12.5 6CB2
Consider the table given in the question:
From the table look for the row supporters and then look for the column of people having age between 18 – 25 Clearly, the number of people between the age of 18 – 25 who are the supporters are 79.

Chapter 12 Data Analysis and Probability Exercise 12.5 6LC
Univariate data set: A set of data that uses only one variable to represent the set of data is called Univariate data set.
For example. The weight of students the particular class. Here there is only one variable that is student weight. Therefore the data set is defined by the weight of the student in the particular class is univariate.
Bivariate data set: A set of data that uses two variables to represent the set of data is called bivariate data set
For example The length and height of the class rooms in a school. Here there are two variables, first the length of the class rooms and the second is the height of the class rooms. Therefore the data set is defined by the length and height of the class rooms in a school is bivariate

Chapter 12 Data Analysis and Probability Exercise 12.5 6MCQ
Algebra 1 Common Core Answers Chapter 12 Data Analysis and Probability Exercise 12.5 6mcq
From the above histogram we see that if we draw vertical line in the middle of the histogram. then the line divide the histogram into two parts that are close to mirror images.
Therefore by the definition of symmetric histogram. “if a vertical line can divide the histogram into two parts that are close to mirror images. then the histogram is symmetric”. Thus, the above histogram is symmetric.

Chapter 12 Data Analysis and Probability Exercise 12.5 7CB1
To design and complete a survey, following points are kept in mind.

  1. The environment, where you collect the data.
  2. Select the appropriate question, for the survey.
  3. Question should be clear with no ambiguity.
  4. The people and the group of the people you have to study are not bias.
  5. Allow for all the possible answer to the people.
  6. Then summarize the data which you are collected.

These are the points to keep in mind while conduction of your test.

Chapter 12 Data Analysis and Probability Exercise 12.5 7CB2
Consider the statement given in the question:
For the given table in the question. look for the column of age between 26 – 64 So. the number of people in this category who are in support is 55
Algebra 1 Common Core Answers Chapter 12 Data Analysis and Probability Exercise 12.5 7cb2
Therefore, the required ratio is 11 : 6o and the corresponding percentage is 18.3%

Chapter 12 Data Analysis and Probability Exercise 12.5 7E
The data set for favorite recording stars is represented by their attributes or quality Therefore by the definition of qualitative data;
Qualitative data: A data is said to qualitative, if it describes the quality that is the category of the data, and cannot measure, or numerical compared and it has no units. The data set of favorite recording stars describes the category of data and cannot be measured or numerically compared. Therefore, the data set of the favorite recording stars is qualitative.

Chapter 12 Data Analysis and Probability Exercise 12.5 7MCQ
Algebra 1 Common Core Answers Chapter 12 Data Analysis and Probability Exercise 12.5 7mcq
Algebra 1 Common Core Answers Chapter 12 Data Analysis and Probability Exercise 12.5 7mcq1
Algebra 1 Common Core Answers Chapter 12 Data Analysis and Probability Exercise 12.5 7mcq2

Chapter 12 Data Analysis and Probability Exercise 12.5 8CB1
Algebra 1 Common Core Answers Chapter 12 Data Analysis and Probability Exercise 12.5 8cb1
Algebra 1 Common Core Answers Chapter 12 Data Analysis and Probability Exercise 12.5 8cb2
As, from the above table, observe that for cricket the people between age group of 20 – 30 likes the most but for football the people between the age group of 10 – 20 likes most Hence, in general the youth likes football and the adult likes cricket more

Chapter 12 Data Analysis and Probability Exercise 12.5 8CB2
Consider the statement given in the question:
For the given table in the question. look for the column of age having 65 and above So, the number of people in this category who oppose the bond issue is 67.
Algebra 1 Common Core Answers Chapter 12 Data Analysis and Probability Exercise 12.5 8cb2q1
Therefore, the required ratio is 67 : 300 and the corresponding percentage is 22.3%

Chapter 12 Data Analysis and Probability Exercise 12.5 8E
The data set for the best selling DVD5 is represented by their brand name or the quality of the DVD5 Therefore by the definition of qualitative data;
Qualitative data set: A data set is said to qualitative, if it describes the quality that is the category of the data, and cannot measure, or numerical compared and it has no units The data set of best-selling DVDs describes the category of data that is the brand name of best-selling DVD, and it cannot be measured or numerically compared. Therefore, the data set of the best-selling DVD5 is qualitative.

Chapter 12 Data Analysis and Probability Exercise 12.5 8MCQ
Algebra 1 Common Core Answers Chapter 12 Data Analysis and Probability Exercise 12.5 8mcq
Algebra 1 Common Core Answers Chapter 12 Data Analysis and Probability Exercise 12.5 8mcq1
Algebra 1 Common Core Answers Chapter 12 Data Analysis and Probability Exercise 12.5 8mcq2

Chapter 12 Data Analysis and Probability Exercise 12.5 9CB1
The people on whom we performed the survey are the representative of their group Before start the survey, you make sure that the people you survey are the representative of the group on which you are study Therefore, we can only the study only one people in each group. since to study the every people in each group it more time consuming

Chapter 12 Data Analysis and Probability Exercise 12.5 9CB2
Consider the statement given in the question For the given table in the question. look for the column of age between 26 – 64 So. the number of people in this category who oppose the bond issue is 45.
Algebra 1 Common Core Answers Chapter 12 Data Analysis and Probability Exercise 12.5 9cb2
Therefore, the required ratio is 3:20 and the corresponding percentage is 15%.

Chapter 12 Data Analysis and Probability Exercise 12.5 9E
The data set of number of gigabytes in memory cards is represented by the numerical value and it has the unit in bytes. Quantitative data: It measures the quantities of the data and can be describe numerically It has also the units and it can be numerically compared Here data set of number of gigabytes in memory cards are numerically described (countable number), and also has the units gigabytes So. it has the quantitative data Therefore the data set of number of gigabytes in memory cards is quantitative.

Chapter 12 Data Analysis and Probability Exercise 12.5 9MCQ
Algebra 1 Common Core Answers Chapter 12 Data Analysis and Probability Exercise 12.5 9mcq
Algebra 1 Common Core Answers Chapter 12 Data Analysis and Probability Exercise 12.5 9mcq1
Algebra 1 Common Core Answers Chapter 12 Data Analysis and Probability Exercise 12.5 9mcq2

Chapter 12 Data Analysis and Probability Exercise 12.5 10CB2
Algebra 1 Common Core Answers Chapter 12 Data Analysis and Probability Exercise 12.5 10cb2
Algebra 1 Common Core Answers Chapter 12 Data Analysis and Probability Exercise 12.5 10cb2-1
Algebra 1 Common Core Answers Chapter 12 Data Analysis and Probability Exercise 12.5 10cb2-2
Algebra 1 Common Core Answers Chapter 12 Data Analysis and Probability Exercise 12.5 10cb2-3

Chapter 12 Data Analysis and Probability Exercise 12.5 10E
The data set for the prices of TV5 is represented by the numerical value and it has the unit in dollars (S).
Quantitative data: It measures the quantities of the data and can be describe numerically It has also the units and it can be numerically compared Here data set for the prices of This are numerically described that is in the number like 400$ or 500$. Also the data set has unit since the price of TV must be in dollars (S). So. it has the quantitative data Therefore, the data set of number for the prices of This is quantitative.

Chapter 12 Data Analysis and Probability Exercise 12.5 10MCQ
Algebra 1 Common Core Answers Chapter 12 Data Analysis and Probability Exercise 12.5 10mcq
Algebra 1 Common Core Answers Chapter 12 Data Analysis and Probability Exercise 12.5 10mcq1
Algebra 1 Common Core Answers Chapter 12 Data Analysis and Probability Exercise 12.5 10mcq2
Algebra 1 Common Core Answers Chapter 12 Data Analysis and Probability Exercise 12.5 10mcq3

Chapter 12 Data Analysis and Probability Exercise 12.5 11E
The number of CD5 your class mate own is represented by only one variable that the numbers of CDs. Let the variable is n, then it contain the values: n = 1,2,3,4….,n
Univariate data set: A set of data that uses only one variable to represent the set of data is called univariate data set Here there is only one variable that is number of own CD5 Therefore the data set is defined by the number of own CD5 in classmate is univariate. Therefore, the data set for the numbers of CD5 your classmate own is univariate.

Chapter 12 Data Analysis and Probability Exercise 12.5 11MCQ
Algebra 1 Common Core Answers Chapter 12 Data Analysis and Probability Exercise 12.5 11mcq
Algebra 1 Common Core Answers Chapter 12 Data Analysis and Probability Exercise 12.5 11mcq1
Algebra 1 Common Core Answers Chapter 12 Data Analysis and Probability Exercise 12.5 11mcq2
Algebra 1 Common Core Answers Chapter 12 Data Analysis and Probability Exercise 12.5 11mcq3

Chapter 12 Data Analysis and Probability Exercise 12.5 12E
The age and height of friends are represented by two variables. first is age and second is height.
Bivariate data set: A set of data that uses two variables to represent the set of data is called bivariate data set Here there are two variables. first the age and second is the height. Therefore the data set is defined by the age and height of the student is bivariate.

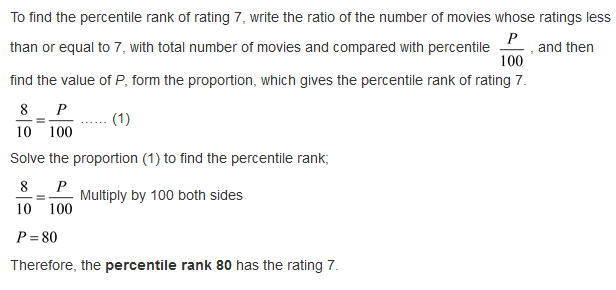
Chapter 12 Data Analysis and Probability Exercise 12.5 12MCQ
Let us consider, on the rating of 10 movies, eight ratings are less than or equal to 7 Let us find the percentile rank of rating 7
Algebra 1 Common Core Answers Chapter 12 Data Analysis and Probability Exercise 12.5 12mcq

Chapter 12 Data Analysis and Probability Exercise 12.5 13E
Consider the zip codes of your relatives.
The objective is determine whether the data set for ZIP code of your relatives is univariate bivariate
Univariate data set: A set of data which uses only one variable to represent the data is called univariate data set. Every relative corresponds to the single ZIP code. because ZIP code is unique everywhere, so it is represented by the only single variable Therefore the data for ZIP code of your relatives is univariate.

Chapter 12 Data Analysis and Probability Exercise 12.5 13MCQ
Let us consider the data set of favorite books Then determine the data set is qualitative of quantitative.The data set of the favorite book is qualitative. By the definition of Qualitative data set, a data set is said to qualitative, if it describes the quality of the data, and cannot measure, or numerical compared and it has no units. The data set of favorite books cannot be measured or numerically compared. Therefore, the data set of the favorite book is qualitative.

Chapter 12 Data Analysis and Probability Exercise 12.5 14E
Consider the circumferences and radii of circles. The objective is to determine the data set for the circumference and the radii of circles is univariate or bivariate.
Bivariate data set: A set of data that uses two variables to represent the set of data is called bivariate data set The circle has two attributes first is circumference and the second is radii. So. we required two variables to represent the data of circles which contain the two types variables circumferences and radii. So the data set has two variables. Therefore, the data set for the circumferences and the radii of circles is bivariate.

Chapter 12 Data Analysis and Probability Exercise 12.5 14MCQ
Let us consider the data set of price of DVDs Let us determine whether the data set is qualitative of quantitative The data set of the price of DVDs is quantitative. By the definition of Quantitative data set, a data set is said to quantitative, if it describes the quantity of the data, and can be measure, and numerical compared and it has units. The data set of price of DVD5 has the units $ (dollar) and also have the numerical value which can be numerically compared. Therefore, the data set of the price of DVD5 is quantitative.

Chapter 12 Data Analysis and Probability Exercise 12.5 15E
Consider a pollster randomly selects 1oo people from each town in a certain candidate’s district to predict the support of the candidates The objective is to determine the sampling method used from the sampling methods, random. systematic. or stratified Here the population is divided into number of certain district, then pollster randomly select 100 people from each district. Use the definition of stratified sampling method;
Stratified sampling method: In this method, population is divided into the number of groups each with certain characteristics, and then random samples are taken from each group. Here the population is divided into the number of district which represents the group. And then sample that is 100 people is randomly selected from each group. Therefore by the definition stratified sampling method. The survey to predict the support of candidate in each city is stratified. The sample is not a good sample. since it assumed that each town has same number of voters. but is not possible that each town has same number of voters. Therefore the sample is not good sample

Chapter 12 Data Analysis and Probability Exercise 12.5 15MCQ
The survey plan is systematic- Since Software business e-mails every thousandth name on an e-mail list By the definition of systematic sampling method. “Select a number n at random, and then survey on every nth person” Here the value of random number n is thousand. selected by the business software and then e-mail to every thousandth name on e-mail list. This is good sample because this sample is not biased

Chapter 12 Data Analysis and Probability Exercise 12.5 16E
Consider a factory tests the every thirtieth shirt made to check the quality.
The objective is to determine the sampling method used from the sampling methods, random. systematic, or stratified Here the test is conducted at every thirtieth shirt made. So. use the definition of systematic sampling method;
Systematic Sampling method: In this method select any number k at random, and then survey every kth person in the sample. Put the value 30 for k, then to factory test at every thirtieth shirt is systematic Thus the sampling method to factory test to the quality of every thirtieth shirt is systematic  The sample is not a good sample. since the test is conducted at fixed number that is every thirtieth shirt made. may have good quality or may not have good quality which will not decide the quality of the entire batch Therefore the sample is not good sample.

Chapter 12 Data Analysis and Probability Exercise 12.5 16MCQ
Algebra 1 Common Core Answers Chapter 12 Data Analysis and Probability Exercise 12.5 16mcq
First, you have to find the range and the interquartile range of the data set (1):
Range: The range of a set of data is defined as the difference between the greatest and the least data values in that set of data. The maximum and minimum data values in the data set (1) are 10 and 1. So
Range = 10 – 1
= 9
Range: 9
Interquartile Range: It is defined as the difference between third and first quartiles of a set of data.
First Quartile: If the data set is divided into four equal parts, then the first quartile is the median of the lower half of an ordered data and it is represented by Q1. The median of the lower half of the data is 3.
First quartile Q1 = 3
Third Quartile: If the data set is divided into four equal parts, then the third quartile is the median of the upper half of an ordered data and it is represented by. The median of the upper half of the data is 9.
Third quartile Q3 = 9
Then the interquartile range of the data set (1) is;
Interquartile range Q3-Q1
=9-3
=6
Interquartile range: 6
Find the range and the interquartile range of the data set (2):
Range: The maximum and minimum data values in the data set (2) are 11 and 1. So
Range =11-1
=10
Range: 10
Interquartile Range: It is the difference between third and first quartiles of a set of data.
First Quartile: The first quartile is the median of the lower half of the data and it is represented by Q1. The median of the lower half of the data is 2.
First quartile Q1 = 2
Third Quartile: The third quartile is the median of the upper half of the data and it is represented by Q3. The median of the upper half of the data is 7.
Third quartile Q3 = 7
Then the interquartile range of the data set (2) is;
Interquartile range = Q3-Q1
=7-2
=5
Interquartile range: 5
Therefore, the range and the interquartile range of the data set (1) are 9 and 6 respectively. The range and the interquartile range of the data set (2) are 10 and 5. This shows that the statement, “the data set which have greater interquartile range have greater range is not correct”, because here you see that the data set (1) has greater interquartile range that is 6 in compare to data set (2) (interquartile range 5), but the data set (2) has the greater range that is 11 (6) in compare to data set (1) (range is 10). So, the statement, the data set which have greater interquartile range have greater range is could not always true it may be true in some data set.

Chapter 12 Data Analysis and Probability Exercise 12.5 17E
Consider a printing company randomly selects 10 out of 450 books printed.
The objective is to determine the sampling method used from the sampling methods, random, systematic, or stratified. The 10 books are randomly selected out of 450 books. So use the definition of random sampling method Random Sampling method: In this method survey on a population at random. That is select random number of sample from the population. Therefore, by the definition of random sampling method, the sampling method to randomly select 10 out of 450 books is printed is. random The sample method produce good samples, since we select the random number that is we select 10 book randomly out of 450, therefore the sample is a . good sample.

Chapter 12 Data Analysis and Probability Exercise 12.5 17MCQ
When each measure of central tendency most useful:
If a data set does not contain an outlier, an outlier is the data value that is much greater or less than the other values in the data set, then mean is most useful to describe the middle of the data set.
For example: let us consider a data set that does not contain an outlier.
Algebra 1 Common Core Answers Chapter 12 Data Analysis and Probability Exercise 12.5 17mcq
Check the given data set (1) for an outlier. You see that there is no outlier, in the data set. So, use means to describe the middle of a set of data.
If the data set has an outlier, an outlier is the data value that is much greater or less than the other values in the data set then median is most useful to describe the middle of the data set.
For example: let us consider a data set that contains an outlier.
1 29 30 31 33 33 …… (2)
Check the given data set (2) for an outlier. You see that the data set contain an outlier. So, use median to describe the middle of a set of data. Median is most useful to describe the middle of the data set
If the data items or the data set represent nonnumeric values or most popular items, then mode is the most useful to describe the middle of the data set.

Chapter 12 Data Analysis and Probability Exercise 12.5 18E
Consider the following statement:
“Since global warming is a big problem, do you support the government funding of the studies on global warming”. Objective is to determine the survey question is biased or not. The survey question is, “Do you support government funding of study on global warming”. The definition of bias is: if the question contains the assumptions that may or may not be true, then the survey question is said to be bias. Otherwise, the question of the survey is not bias. Here, the word government funding is just like an assumption which may or may not be true. So, the survey question is biased. Also, the word government funding, influence the answer of the people. Therefore the question, “Do you support government funding of study on global warming” is biased.

Chapter 12 Data Analysis and Probability Exercise 12.5 18MCQ
Algebra 1 Common Core Answers Chapter 12 Data Analysis and Probability Exercise 12.5 18mcq
Algebra 1 Common Core Answers Chapter 12 Data Analysis and Probability Exercise 12.5 18mcq1

Chapter 12 Data Analysis and Probability Exercise 12.5 19E
The objective is to determine whether the survey question is biased or not. The survey question is that where he would most like to go on vacation.
Use the definition of bias for the survey question. A survey question is said to be bias if it contains the assumptions that may or may not be true, otherwise the question of the survey is not bias. Here, the survey question does not contain the assumption. The people can response the answer of the question randomly. So the question does not influence the answer. Therefore the question, “Where would you most like to go on vocation”, is . not biased.

Chapter 12 Data Analysis and Probability Exercise 12.5 19MCQ
Let us consider a survey conducted by local resident on type of TV channels. The local resident asks, “Do you prefer news or entertainment channels”. The question is unbiased because the word news or entertainments are not biased. To choose good sample for survey, conduct random sampling method on the population.

Chapter 12 Data Analysis and Probability Exercise 12.5 20E
The objective is to determine whether the survey question is biased or not. The survey question is that whether he prefers shopping online or the excitement of going to stores with friends. Use the definition of bias for the survey question. A survey question is said to be bias if it contains the assumptions that may or may not be true. otherwise the question of the survey is not bias. The survey question contains the assumption word like “Excitement”, which influences the answer The answer is also varying from the sample to sample. So we can say that the question is biased Therefore the question. “Do you prefer shopping online or the excitement of going to stores with friends is baised.

Chapter 12 Data Analysis and Probability Exercise 12.5 20MCQ
A data is said to qualitative, if it describes the quality of the data, and cannot measure, or numerical compared and it has no units. Mode is best measure of central tendency when the data is non numeric, or data items are choosing from the most popular items Therefore. mode is the most appropriate for the qualitative data

Chapter 12 Data Analysis and Probability Exercise 12.5 21E
The objective is to determine whether the survey question is biased or not and then the sample is representative of the population In the sample. it is chosen only 100 homes during the day Of 85% are the over the age of 60. So. there may be chances to people whose age is less than 60 are also in the work during the day Also, the characteristics of sample and population are not same Thus, the sample chosen is biased Therefore, the sample is not representative of the population

Chapter 12 Data Analysis and Probability Exercise 12.5 22E
The objective is to determine whether the survey question is biased or not and then the sample is representative of the population In the sample. every fourth person at the local dog park is not the representative of the groups And also some people are not present in the dog park By the definition of the characteristics of the sample. if sample and their population have not same characteristics, then the result of the sample is biased The characteristics of sample and population are not same. Thus, the result of the sample question is biased Therefore the sample is not representative of the population

Chapter 12 Data Analysis and Probability Exercise 12.5 23E
Algebra 1 Common Core Answers Chapter 12 Data Analysis and Probability Exercise 12.5 23e
The results of survey question are not same because each sample is a random sample From the above table we see that result of survey question in both class that is the Group A and the Group B. both are different. Group A. 8 people chose red color, and in Group B, 7 people chose the red color In Group A, 6 people chose blue color and in group B 7 people chose blue color Green color is chosen by 4 people from Group A and 3 people from Group B similarly others colors are chosen by the people of both group are randomly. So. we can say that the result of the both group are random. Thus. the sample is a random.

Chapter 12 Data Analysis and Probability Exercise 12.5 24E
To find the music preference of entire school, we conduct a survey by asking the question, “What type of music would like to listen”, to the some student of the school randomly. Also, keeping in the mind the student of the school represent the population, and we conduct a survey in some student which represent the sample. Use the random sampling method is used, so, that the sample is unbiased. If you use the random sampling method, then the result of the sample is unbiased, since the random sampling method does not contain any assumption, which is either true of not true. Therefore, we chose random sampling method to choose the sample, so that the sample is unbiased. First we select the some student of the school randomly, and then write the survey question, such that it does not contain any assumption, because assumption may or may not be true. By the definition of bias survey question, if the survey contains assumption then it is bias. Therefore, we write the question, so that it does not contain any assumption or any influence word which influence the answer of the question.

Chapter 12 Data Analysis and Probability Exercise 12.5 25E
The objective is to determine whether each factor create bias in the survey result.
Since the agent interviews the people at an international airport, at the international airport most of the people who are present are likely to travel abroad. Therefore, the result of the survey question is biased. The survey question, “Would you prefer to vocation in France or in Italy”, contain the influence word France and Italy, which might be influence the answer of the people. The respondents also might prefer neither France nor Italy. Therefore, the survey question creates a bias result. Since 86 % the people took a French class in high school, so more people be prefer to France trip. Because they know the French language, so it creates a bias result in the sample. Therefore, the survey question creates a bias result.

Chapter 12 Data Analysis and Probability Exercise 12.5 26E
The error in the survey question, “Don’t you think the legal voting age should be lower”, is Don’t. Because the word, “Don’t” create the bias sample result. The correct survey question is, “Would you think the legal voting age should be lower”. This survey question is meaningful, and does not contain any influencing word, so that it affects the result of the question. Therefore, the survey question,” Would you think the legal voting age should be lower” is unbiased, since it does not contain any assumption.

Chapter 12 Data Analysis and Probability Exercise 12.5 27E
Consider the situation, the owner of sports goods store asks every fifteenth customer that which sports he or she most enjoys watching on TV. The objective is to identify the population and sample and then determine whether the sample is random, systematic, and stratified sample. Here the store owner surveys the people who are the customers of the store. Thus, the population is all the people who is the customer of the store. And the sample is every fifteenth customer of the store. Since the store owner survey every fifteenth customer of the store, that is ask the survey question to the every fifteenth customer of the store. So, the survey is conducted at fixed number of customer. Use the definition of systematic sampling method.
Systematic sample: If select any number k at random, and then survey every kth person in the population, then the sample is called systematic sample. Here the store owner surveys the people who are the customers of the store. Thus, the population is all the people who is the customer of the store. And the sample is every fifteenth customer of the store. Since the store owner survey every fifteenth customer of the store, that is ask the survey question to the every fifteenth customer of the store. So, the survey is conducted at fixed number of customer. Use the definition of systematic sampling method. Systematic sample: If select any number k at random, and then survey every kth person in the population, then the sample is called systematic sample.
Put the value k=15, then by the definition of systematic sampling, the survey of every fifteenth customer who comes to store is systematic. Therefore, the survey at every fifteenth customers of the store is.Put the value, then by the definition of systematic sampling, the survey of every fifteenth customer who comes to store is systematic. Therefore, the survey at every fifteenth customers of the store is. Systematic.

Chapter 12 Data Analysis and Probability Exercise 12.5 28E
Consider the situation: one student from each club is taken at random to represent the school at the school fair. The objective is to identify the population and sample and then determine whether the sample is random, systematic and stratified sample. One student from each club is chosen at random to represent the school So the population is the all the student of the school, and the sample is the student who is the chosen from club at random The population is divided into schools, each school represent the population and one student of each club is the sample of the population. and then the survey is done in one student in each club to represent the school in the school fair, so use the definition of s stratified sampling method
Stratified sampling method: In this method, population is divided into the number of groups. and then random samples are taken from each groups and survey Therefore, the surveys at one student from each club is chosen at random to represent the school at the school fair is Stratified.

Chapter 12 Data Analysis and Probability Exercise 12.5 29E
Consider at every spectator place his or her tickets of all the attendees are kept in bowl and after the game. the coach had chosen ten people to march the in the victory parade. The objective is to identify the population and sample and then determine whether the sample is random, systematic. and stratified sample. the population is all the people who attend the game that is the population is all the attendees of the game, and the sample is ten people who had been selected by coach to march in the victory parade.
Random Sampling method: In this method survey on a population at random, that is survey on the people ID number are drawn out of a hat and survey those student. Here from the bowl ten tickets is draw, each tickets is correspond to particular attendee of the game. and then select these ten attendee to march in the victory parade of the game. Therefore, the sample is random

Chapter 12 Data Analysis and Probability Exercise 12.5 30E
Consider the situation, a restaurant people ask every third customer to complete an evaluation form The objective is to identify the population and sample and then determine whether the sample is random, systematic. and stratified sample Here the restaurant asks every third customer to complete an evaluation form Therefore. the population is all the people who are the customer of restaurant that is all the customer of the restaurant is the population And the sample is every third customer of the restaurant The survey is conducted at fixed number of customer therefore we use the definition of systematic sampling method;
Systematic sample: If select any number k at random, and then survey every person in the population. then the sample is called systematic sample.
Put the value k = 3. then by the definition of systematic sampling, the survey of every third customer who comes to restaurant is systematic Therefore, the sample is systematic

Chapter 12 Data Analysis and Probability Exercise 12.5 31E
Consider the data for the average number of visitors per day at six different theme parks The objective is determine the above data is qualitative or quantitative and also determine univariate or bivariate. The data for the average number of visitors per day at each of six different theme parks is represented by the numerical value.
Quantitative data: it the data has described by the numerical value or its measures the quantities of the data then data is said to be quantitative It has also the units and it can be numerically compared Here data set of the average number of visitors per day at each of six different theme parks are numerically described (countable number). and also it has numerically compared so. it is the quantitative data. Therefore the data for the average number of visitors per day at each of six different theme parks is quantitative. The number of visitors per day at each of six different theme parks is represented by only one variable numbers
That is for the any variable n such that n = 1,2,3,4,…, n
Univariate data set: A set of data that uses only one variable to represent the data is called univariate data set Here there is only one variable that represent the number of visitors Therefore, the data set for the average number of visitors per day at each of six different theme parks is univariate.

Chapter 12 Data Analysis and Probability Exercise 12.5 32E
Consider the data monthly low temperatures The objective is determine the data is qualitative or quantitative and also univariate or bivariate. The data to represent the temperature of the city has the numerical value, since the temperature is only represented with numerical data. and it has also unit like Celsius, Fahrenheit.
Quantitative data: it the data has described by the numerical value or its measures the quantities of the data then data is said to be quantitativeS It has also the units and it can be numerically compared. Here data for the temperature is described by the numerical value and it compared numerically. And it has the unit, so. it is the quantitative data. Therefore the data for monthly low temperature in Rochester is quantitative The temperature is represented by only single variable, since it only one numerical value for the particular instant of time. Let us consider the variable x represent the low temperature of the Rochester city
Then, x=…,—4,—3—2,—1,O,1,2,3,4,…
Univariate data set: A set of data that uses only one variable to represent the data is called univariate data set Here there is only one variable that represent the low temperature
Therefore, the data set for the monthly low temperature in Rochester New York is I univariate.

Chapter 12 Data Analysis and Probability Exercise 12.5 33E
Consider the data for the name of US Presidents and the state where born in Classify the above data is qualitative or quantitative and either univariate or bivariate The data to represent the name and state of the US President where born in, require the name of president and the name place where they born. That is both are described by the attributes of the President Therefore, by the definition of qualitative data;
Qualitative data: A data is said to qualitative, if it describes the quality or attribute of the data. and cannot measure, or numerical compared and it has no units The data set of the name and state of the U.S. President where born in. contain only the name of president and the name of state where born, it does not contain any numerical value Therefore, the data set of the name of US Presidents and the state where born in is qualitative. To represent. the name and state where born of US. President, in the data set require two variables one for the name second for the state where they born. Therefore, by the definition of bivariate;
Bivariate data set:
The set contains two variables data is called bivariate data set. Here, there are two variables are required one for the name and second for the state where born in Therefore, the data set for the name of U.S. Presidents and the state where born in is bivariate.

Chapter 12 Data Analysis and Probability Exercise 12.5 34E
Consider the data for the favorite color and person’s gender.
Classify the above data is qualitative or quantitative and either univariate or bivariate. The data to represent the favorite color and person’s gender require the color name and gender either male or female. That is both are described by the attributes of the person’s. Therefore, by the definition of qualitative data;
Qualitative data: A data is said to qualitative, if it describes the quality or attribute of the data. and cannot measure, or numerical compared and it has no units. The data set of the name favorite color and person’s gender contain the favorite color name and gender of the person’s. it does not contain any numerical value Therefore, the data set of the favorite color and person’s gender is qualitative.
To represent. the favorite color and person’s gender in the data set require two variable one for the favorite color name and second for the person’s gender Therefore, by the definition of bivariate
Bivariate data set:
A set of two variables data is called bivariate data set. Here, there are two variables one is for the favorite color name and second for the person gender Therefore, the data for the favorite color and person’s gender is bivariate

Chapter 12 Data Analysis and Probability Exercise 12.5 35E
Algebra 1 Common Core Answers Chapter 12 Data Analysis and Probability Exercise 12.5 35e
(a)
In the result of the survey question is bias. because some students are like to choose more than one favorite sports. and they select a single sport which produced the result of the survey question is bias, that is the responses from the voluntary are biased Also, only five sports are given, there may be chances to some students are like to other sports apart from five, this cause a bias result of the survey
(b)
The result of the survey is not valid. because the responses of the students are not produced the similar result Very less number of students is like baseball, and the more number of students are like Colt Therefore, the result of the survey is not valid

Chapter 12 Data Analysis and Probability Exercise 12.5 36E
Survey on every tenth person leaving a bicycle repair store:
The result of the survey gives a bias sample Since every tenth person leaving bicycle repair store may not reading the school newspaper You are survey on every tenth person. so. by the definition of systematic sampling method
Systematic sample:
If select any number k at random, and then survey every J(th person in the population, then the sample is called systematic sample Put the value k = 10. then by the definition of systematic sampling, then the survey of every tenth person who leaving the bicycle repair store is systematic. By the definition of the systematic sampling method, the result of the survey is biased Therefore, the sample is biased.
(b)
The result of the survey gives unbiased sample. Because you are call your neighborhoods every morning through Monday to Friday- Therefore, the sampling method is random and the result of the random sampling method gives unbiased sample
(C)
Consider the sample “you send an e-mail to loo classmates at random” So. use the definition of random sampling method;
Random Sampling method:
In this method survey on a population at random, that is survey on the people ID number are drawn out of a hat and survey those students The result of the random sampling gives the unbiased sample Here, student sends e-mail to his 100 classmates at random Therefore, the sampling method is random the result gives unbiased sample
(d)
Survey on every fifth person in popular local sandwich shop. gives bias sample: Since more persons who are not come to local sandwich shop. gives biased sample The survey of every fifth, so by use the definition of systematic sampling method.
Systematic sample:
If select any number k at random, and then survey every kth person in the population. then the sample is called systematic sample Put the value k = 5. then by the definition of systematic sampling, and then the survey on every fifth person in popular local sandwich shop is systematic By the definition of the systematic sampling method, the result of the survey is biased Therefore, the sample is biased.

Chapter 12 Data Analysis and Probability Exercise 12.5 37E
Consider the statement given in the question:
As the company has send sample of new sent to 500 homes, the response may vary people to people. People. who will like the scent, will send back a response others who don’t like the scent will not sent back the response.

Chapter 12 Data Analysis and Probability Exercise 12.5 38E
The person who are not listen the call from radio station, they cannot give their choice. Sixty eight percent of the callers listen the call and select the certain candidate in an upcoming election. So. the result of the survey question is biased.
Also, more people are selecting a certain candidate, and the survey question contains the assumption which may be influence the result of the survey. The survey question also contains the word. sixty eight percent. which also influence the result of the survey Therefore, the result of the survey question is biased.
The conclusion is not valid. because the result of the survey question is biased More people likely to not listener of the call which is relay from the radio station They are not given their opinion for this election So. the result is biased and the conclusion is not valid.

Chapter 12 Data Analysis and Probability Exercise 12.5 39E
Algebra 1 Common Core Answers Chapter 12 Data Analysis and Probability Exercise 12.5 39e
The question may vary as someone can ask the breed f dog which is a qualitative approach and someone can ask about the number of pets. which is a qualitative approach Hence, data will vary according to the question.
Population method includes the number of pets in the household over the whole population. It can vary for a city. a state or a country. Now, the sampling method refers to the data taken over small area, which will be more accurate as compared to the population sampling due to its size.
Algebra 1 Common Core Answers Chapter 12 Data Analysis and Probability Exercise 12.5 39e1

Chapter 12 Data Analysis and Probability Exercise 12.5 40E
The toothpaste company reports that four out of live dentists recommended their toothpaste Let us identify the information which makes the result of the survey is bias The result of the survey is dependent of the survey question Here the survey question is not given. Therefore, the required survey question to determine the result of the survey is unbiased. Check the survey question. whether it contains any assumption or any influencing word that makes the result of the survey is bias or not. lithe survey question does not contain any assumption. then the result of the survey is unbiased

Chapter 12 Data Analysis and Probability Exercise 12.5 41E
Algebra 1 Common Core Answers Chapter 12 Data Analysis and Probability Exercise 12.5 41e
Algebra 1 Common Core Answers Chapter 12 Data Analysis and Probability Exercise 12.5 41e1

Chapter 12 Data Analysis and Probability Exercise 12.5 42E
Algebra 1 Common Core Answers Chapter 12 Data Analysis and Probability Exercise 12.5 42e
Algebra 1 Common Core Answers Chapter 12 Data Analysis and Probability Exercise 12.5 42e1
Algebra 1 Common Core Answers Chapter 12 Data Analysis and Probability Exercise 12.5 42e2

Chapter 12 Data Analysis and Probability Exercise 12.5 43E
Algebra 1 Common Core Answers Chapter 12 Data Analysis and Probability Exercise 12.5 43e
Algebra 1 Common Core Answers Chapter 12 Data Analysis and Probability Exercise 12.5 43e1
Algebra 1 Common Core Answers Chapter 12 Data Analysis and Probability Exercise 12.5 43e2

Chapter 12 Data Analysis and Probability Exercise 12.5 44E
Consider a reporter is trying to predict who will win an open seat on the city council. 20 coworkers are thinking that they will win an open seat. Identify this plan is produce a good sample or not. Since the reporter ask 20 coworker, which is the representative of their groups. They predict the person who win they will win. Coworker is the representative of the group. so their prediction is not bias Therefore, the sample is good sample to predict an open seat election on the city.

Chapter 12 Data Analysis and Probability Exercise 12.5 45E
Consider, of 30 test scores, 12 are less than or equal to 85.
Object is to rind the percentile rank of test score 85.
Algebra 1 Common Core Answers Chapter 12 Data Analysis and Probability Exercise 12.5 45e
Algebra 1 Common Core Answers Chapter 12 Data Analysis and Probability Exercise 12.5 45e1

Chapter 12 Data Analysis and Probability Exercise 12.5 46E
Consider 15 bands in a competition 9 bands are score 75 or lower.
Object is to find, the percentile rank of score 75.
Algebra 1 Common Core Answers Chapter 12 Data Analysis and Probability Exercise 12.5 46e
Algebra 1 Common Core Answers Chapter 12 Data Analysis and Probability Exercise 12.5 46e1

Chapter 12 Data Analysis and Probability Exercise 12.5 47E
Consider an ineqUality 4…. 3a < 3a —2 …………………..(1)
Object is to solve the inequality (1).
Algebra 1 Common Core Answers Chapter 12 Data Analysis and Probability Exercise 12.5 47e
Algebra 1 Common Core Answers Chapter 12 Data Analysis and Probability Exercise 12.5 47e1

Chapter 12 Data Analysis and Probability Exercise 12.5 48E
Consider an inequality 3(x—2)≤6x+3 …. (1)
Object is to solve the inequality (1).
Algebra 1 Common Core Answers Chapter 12 Data Analysis and Probability Exercise 12.5 48e
Algebra 1 Common Core Answers Chapter 12 Data Analysis and Probability Exercise 12.5 48e1

Chapter 12 Data Analysis and Probability Exercise 12.5 49E
The objective is to solve the inequality for the variable b
Subtract 21 on both sides of the inequality
Add on both sides
Divide both sides by 35
Therefore, the solution of the inequality is
Check the end points:
The end point and choose a value greater than
Now substitute in.
Now substitute
Therefore, the solution checks

Chapter 12 Data Analysis and Probability Exercise 12.5 50E
Consider the fraction:
Simplify the fraction
The fraction can be written as follows:
By algebra rule
Therefore, the simplified form of the fraction is.

Chapter 12 Data Analysis and Probability Exercise 12.5 51E
Consider the fraction:
Simplify the fraction.
The fraction can be written as follows:
By algebra rule
Therefore, the simplified form of the fraction is.

Chapter 12 Data Analysis and Probability Exercise 12.5 52E
Consider the fraction:
Simplify the fractionS
The fraction can be written as follows:
By algebra rule
Therefore, the simplified form of the fraction is

Algebra 1 Common Core Answers Chapter 12 Data Analysis and Probability Exercise 12.4

Algebra 1 Common Core Answers Student Edition Grade 8 – 9 Chapter 12 Data Analysis and Probability Exercise 12.4

Algebra 1 Common Core Solutions

Chapter 12 Data Analysis and Probability Exercise 12.4 1LC
algebra-1-common-core-answers-chapter-12-data-analysis-and-probability-exercise-12-4  1lc
algebra-1-common-core-answers-chapter-12-data-analysis-and-probability-exercise-12-4  1lc1
algebra-1-common-core-answers-chapter-12-data-analysis-and-probability-exercise-12-4  1lc2
algebra-1-common-core-answers-chapter-12-data-analysis-and-probability-exercise-12-4  1lc3

Chapter 12 Data Analysis and Probability Exercise 12.4 2LC
algebra-1-common-core-answers-chapter-12-data-analysis-and-probability-exercise-12-4  2lc
algebra-1-common-core-answers-chapter-12-data-analysis-and-probability-exercise-12-4  2lc1
algebra-1-common-core-answers-chapter-12-data-analysis-and-probability-exercise-12-4  2lc2
algebra-1-common-core-answers-chapter-12-data-analysis-and-probability-exercise-12-4  2lc3
algebra-1-common-core-answers-chapter-12-data-analysis-and-probability-exercise-12-4  2lc4

Chapter 12 Data Analysis and Probability Exercise 12.4 3LC
algebra-1-common-core-answers-chapter-12-data-analysis-and-probability-exercise-12-4  3lc
Interquartile range: the interquartile range is defined as the length of the box or difference between third and first quartiles. The graph of the box-and-whisker plot shows that, the length of box of Alass B is more widely than the length of the box of Class k Therefore, the interquartile range of the Class B is greater than the interquartile range of the Class A.

Chapter 12 Data Analysis and Probability Exercise 12.4 4LC
algebra-1-common-core-answers-chapter-12-data-analysis-and-probability-exercise-12-4  4lc

Chapter 12 Data Analysis and Probability Exercise 12.4 5LC
algebra-1-common-core-answers-chapter-12-data-analysis-and-probability-exercise-12-4  5lc
algebra-1-common-core-answers-chapter-12-data-analysis-and-probability-exercise-12-4  5lc1

Chapter 12 Data Analysis and Probability Exercise 12.4 6LC
algebra-1-common-core-answers-chapter-12-data-analysis-and-probability-exercise-12-4  6lc

Chapter 12 Data Analysis and Probability Exercise 12.4 7LC
No because the test is graded on scale, so it may be the point value between 0 and 100 The percentile ranke represent the percentage of data values that are less than of equal to the
values.
If the lowest grade is 78. and all other grade has the value greater than 78. then the percentile of grade 78 is not 78. Therefore, you can not says that if your score is 78 in the scale of 0 to loo your percentile must be 7W

Chapter 12 Data Analysis and Probability Exercise 12.4 8E
algebra-1-common-core-answers-chapter-12-data-analysis-and-probability-exercise-12-4  8e
algebra-1-common-core-answers-chapter-12-data-analysis-and-probability-exercise-12-4  8e1
algebra-1-common-core-answers-chapter-12-data-analysis-and-probability-exercise-12-4  8e2

Chapter 12 Data Analysis and Probability Exercise 12.4 9E
algebra-1-common-core-answers-chapter-12-data-analysis-and-probability-exercise-12-4  9e
algebra-1-common-core-answers-chapter-12-data-analysis-and-probability-exercise-12-4  9e1
algebra-1-common-core-answers-chapter-12-data-analysis-and-probability-exercise-12-4  9e2

Chapter 12 Data Analysis and Probability Exercise 12.4 10E
algebra-1-common-core-answers-chapter-12-data-analysis-and-probability-exercise-12-4  10e
algebra-1-common-core-answers-chapter-12-data-analysis-and-probability-exercise-12-4  10e1
algebra-1-common-core-answers-chapter-12-data-analysis-and-probability-exercise-12-4  10e2

Chapter 12 Data Analysis and Probability Exercise 12.4 11E
algebra-1-common-core-answers-chapter-12-data-analysis-and-probability-exercise-12-4  11e
algebra-1-common-core-answers-chapter-12-data-analysis-and-probability-exercise-12-4  11e1
algebra-1-common-core-answers-chapter-12-data-analysis-and-probability-exercise-12-4  11e2

Chapter 12 Data Analysis and Probability Exercise 12.4 12E
algebra-1-common-core-answers-chapter-12-data-analysis-and-probability-exercise-12-4  12e
algebra-1-common-core-answers-chapter-12-data-analysis-and-probability-exercise-12-4  12e1
algebra-1-common-core-answers-chapter-12-data-analysis-and-probability-exercise-12-4  12e2

Chapter 12 Data Analysis and Probability Exercise 12.4 13E
algebra-1-common-core-answers-chapter-12-data-analysis-and-probability-exercise-12-4  13e
algebra-1-common-core-answers-chapter-12-data-analysis-and-probability-exercise-12-4  13e1
algebra-1-common-core-answers-chapter-12-data-analysis-and-probability-exercise-12-4  13e2
algebra-1-common-core-answers-chapter-12-data-analysis-and-probability-exercise-12-4  13e3

Chapter 12 Data Analysis and Probability Exercise 12.4 14E
algebra-1-common-core-answers-chapter-12-data-analysis-and-probability-exercise-12-4  14e
algebra-1-common-core-answers-chapter-12-data-analysis-and-probability-exercise-12-4  14e1
algebra-1-common-core-answers-chapter-12-data-analysis-and-probability-exercise-12-4  14e2
algebra-1-common-core-answers-chapter-12-data-analysis-and-probability-exercise-12-4  14e3

Chapter 12 Data Analysis and Probability Exercise 12.4 15E
algebra-1-common-core-answers-chapter-12-data-analysis-and-probability-exercise-12-4  15e
algebra-1-common-core-answers-chapter-12-data-analysis-and-probability-exercise-12-4  15e1
algebra-1-common-core-answers-chapter-12-data-analysis-and-probability-exercise-12-4  15e2
algebra-1-common-core-answers-chapter-12-data-analysis-and-probability-exercise-12-4  15e3

Chapter 12 Data Analysis and Probability Exercise 12.4 16E
algebra-1-common-core-answers-chapter-12-data-analysis-and-probability-exercise-12-4  16e
The box of Cars is greater than the box of Trucks, so the cars have greatest interquartile range. This means that the 50% of the fuel efficiency cars are widely spread than the trucks.
The 50 % fuel efficiency of cars is lies in between the 18 to 20 miles. while on the other hand 50% of the fuel efficiency of truck is lies between the 14 to 15 miles. Therefore the fuel efficiency of is vary more widely than the trucks.

Chapter 12 Data Analysis and Probability Exercise 12.4 17E
Let us consider, Of lo test scores, six are less than or equal to 80 Let us find, what is the percentile rank of test score 80
algebra-1-common-core-answers-chapter-12-data-analysis-and-probability-exercise-12-4  17e

Chapter 12 Data Analysis and Probability Exercise 12.4 18E
Let us consider, Of 35 judges’ scores. 28 are less than or equal to 75
Let us td. what is the percentile rank of a score 75
algebra-1-common-core-answers-chapter-12-data-analysis-and-probability-exercise-12-4  18e

Chapter 12 Data Analysis and Probability Exercise 12.4 19E
Consider the statement given in the question:
Percentile rank is defined as the percentage of data values that are less than or equal to that value
algebra-1-common-core-answers-chapter-12-data-analysis-and-probability-exercise-12-4  19e
algebra-1-common-core-answers-chapter-12-data-analysis-and-probability-exercise-12-4  19e1

Chapter 12 Data Analysis and Probability Exercise 12.4 20E
algebra-1-common-core-answers-chapter-12-data-analysis-and-probability-exercise-12-4  20e
algebra-1-common-core-answers-chapter-12-data-analysis-and-probability-exercise-12-4  20e1

Chapter 12 Data Analysis and Probability Exercise 12.4 21E
Consider the statement given in the question:
Percentile rank is defined as the percentage of data values that are less than or equal to that value
algebra-1-common-core-answers-chapter-12-data-analysis-and-probability-exercise-12-4  21e

Chapter 12 Data Analysis and Probability Exercise 12.4 22E
Let us consider, the median of 10 number of data set is 22, an interquartile range is 10, and a minimum less than 4 Make a data for the above information
algebra-1-common-core-answers-chapter-12-data-analysis-and-probability-exercise-12-4  22e
algebra-1-common-core-answers-chapter-12-data-analysis-and-probability-exercise-12-4  22e1

Chapter 12 Data Analysis and Probability Exercise 12.4 23E
algebra-1-common-core-answers-chapter-12-data-analysis-and-probability-exercise-12-4  23e

Chapter 12 Data Analysis and Probability Exercise 12.4 24E
algebra-1-common-core-answers-chapter-12-data-analysis-and-probability-exercise-12-4  24e
a. The box-and-whisker plot of the Device 2. shows that the median is lies middle of the box and
for the Device 1 the median is not in the middle of the box So the box of Device 2 is more consistent than the box of Device 1 Therefore the package produce by device I is more consistent
b. The manufacturer choose device ito minimize the number of packages with weight less than
17 and more than 17.2. Since the box of the device 1 is smaller size than the box of the device 2. The box of device 2 is wider so its package size is greater than the device 1. Therefore the manufacturer choose the device I to minimize the number of packages with weight less than 17 and more than 17.2.

Chapter 12 Data Analysis and Probability Exercise 12.4 25E
algebra-1-common-core-answers-chapter-12-data-analysis-and-probability-exercise-12-4  25e

Chapter 12 Data Analysis and Probability Exercise 12.4 26E
Let us consider. Of 100 people that take a test, nine have scores greater than 93. Then what is the percentile rank of a score 93
algebra-1-common-core-answers-chapter-12-data-analysis-and-probability-exercise-12-4  26e

Chapter 12 Data Analysis and Probability Exercise 12.4 27E
algebra-1-common-core-answers-chapter-12-data-analysis-and-probability-exercise-12-4  27e
algebra-1-common-core-answers-chapter-12-data-analysis-and-probability-exercise-12-4  27e1

Chapter 12 Data Analysis and Probability Exercise 12.4 28E
algebra-1-common-core-answers-chapter-12-data-analysis-and-probability-exercise-12-4  28e
Range: The range of a set of data is the difference between the greatest and the least data values
The maximum and the minimum value in the set of data given in (1) are 120 and 32
respectively So the range is
Range= 120—32
=88
Range: 88

Chapter 12 Data Analysis and Probability Exercise 12.4 29E
Let us consider Jared can clear his driveway of snow in 36 min and his brother takes 48 min. then you have to find to the nearest minute. how long it takes to clear the driveway if both are work together.
algebra-1-common-core-answers-chapter-12-data-analysis-and-probability-exercise-12-4  29e

Chapter 12 Data Analysis and Probability Exercise 12.4 30E
algebra-1-common-core-answers-chapter-12-data-analysis-and-probability-exercise-12-4  30e
algebra-1-common-core-answers-chapter-12-data-analysis-and-probability-exercise-12-4  30e1

Chapter 12 Data Analysis and Probability Exercise 12.4 31E
algebra-1-common-core-answers-chapter-12-data-analysis-and-probability-exercise-12-4  31e
algebra-1-common-core-answers-chapter-12-data-analysis-and-probability-exercise-12-4  31e1
algebra-1-common-core-answers-chapter-12-data-analysis-and-probability-exercise-12-4  31e2

Chapter 12 Data Analysis and Probability Exercise 12.4 32E
algebra-1-common-core-answers-chapter-12-data-analysis-and-probability-exercise-12-4  32e
algebra-1-common-core-answers-chapter-12-data-analysis-and-probability-exercise-12-4  32e1

Chapter 12 Data Analysis and Probability Exercise 12.4 33E
algebra-1-common-core-answers-chapter-12-data-analysis-and-probability-exercise-12-4  33e
algebra-1-common-core-answers-chapter-12-data-analysis-and-probability-exercise-12-4  33e1
algebra-1-common-core-answers-chapter-12-data-analysis-and-probability-exercise-12-4  33e2
algebra-1-common-core-answers-chapter-12-data-analysis-and-probability-exercise-12-4  33e3
algebra-1-common-core-answers-chapter-12-data-analysis-and-probability-exercise-12-4  33e4