Solving Linear Systems Graphically
Graphical Method – on graph paper
Graphing a system of linear equations is as simple as graphing two straight lines. When the lines are graphed, the solution will be the (x,y) ordered pair where the two lines intersect (cross).
Note: Before you begin, rearrange the equations so they will read “y =”. This process will make it easier to read the slope and y-intercept, for the slope-intercept method of graphing.
Example 1: Solve this system of equations graphically.
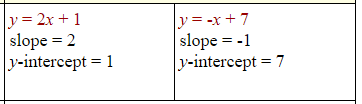
y = 2x + 1 and y = -x + 7
- The equations in this example are already set equal to “y”. Identify the slope and y-intercept in each equation. Remember: y = mx + b, where m = slope and b = y-intercept.
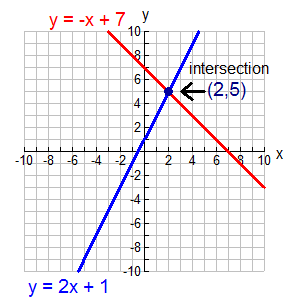
- Graph the lines.
This example used the slope-intercept method of graphing straight lines.
The b-value tells you where the line crosses the y-axis.
The slope, m, tells you the rise over the run.
If you need help graphing lines, see Graphing Linear Equations.
Find the intersection point (where the lines cross).
These lines cross at the point (2,5).
This means the solution to this system is:
Solution: x = 2 and y = 5.
- CHECK: Substitute x = 2 and y = 5 into BOTH of the original equations. If your solutions are correct, both equations will be true!
y = 2x + 1
5 = 2(2) + 1
5 = 5 (check)
y = -x + 7
5 = -(2) + 7
5 = 5 (check)
Two special cases:
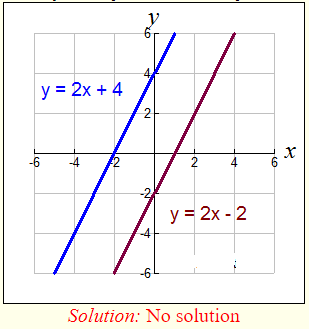
1. Parallel Lines:
If the two linear equations have the same slope (and different y-intercepts), the lines will be parallel. Since parallel lines never intersect, a system composed of two parallel lines will have NO solution (no intersection of the lines.)
Solve system: y = 2x + 4 and y = 2x – 2
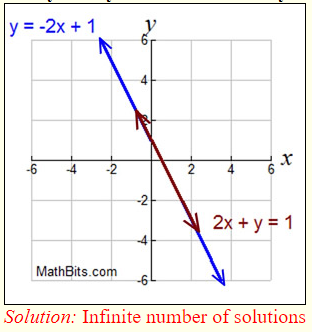
2. Same Line:
If the two linear equations have the same slope (and the SAME y-intercept), the equations represent the same line. Since a line intersects with itself everywhere, there will be an infinite number of solutions (intersecting everywhere.)
Solve system: y = -2x + 1 and 2x + y = 1
Example 2: Solve this system of equations graphically.
x = y + 1 and 2x + y = -7
- Set the equations equal to y to make graphing easier.
y = x – 1
y = -2x – 7 - Identify the slope and y-intercept in each equation.
y = x – 1
slope = 1
y-intercept = -1
y = -2x – 7
slope = -2
y-intercept = -7 - Graph the lines.
Find the intersection point (where the lines cross).
These lines cross at the point (-2,-3).
This means the solution to this system is:
x = -2 and y = -3.

- CHECK: Substitute x = -2 and y = -3 into BOTH of the original equations. If your solutions are correct, both equations will be true!
x = y + 1
-2 = -3 + 1
-2 = -2 (check)
2x + y = -7
2(-2) + (-3) = -7
-4 + (-3) = -7
-7 = -7 (check)