Graphing Linear Inequalities
If you can graph a straight line, you can graph an inequality!
Graphing an inequality starts by graphing the corresponding straight line. After graphing the line, there are only two additional steps to remember.
- Choose a point not on the line and see if it makes the inequality true. If the inequality is true, you will shade THAT side of the line — thus shading OVER the point. If it is false, you will shade the OTHER side of the line — not shading OVER the point.
- If the inequality is LESS THAN OR EQUAL TO or GREATER THAN OR EQUAL TO, the line is drawn as a solid line. If the inequality is simply LESS THAN or GREATER THAN, the line is drawn as a dashed line.
Graphing an Inequality
- Solve the equation for y (if necessary).
- Graph the equation as if it contained an = sign.
- Draw the line solid if the inequality is ≤ or ≥.
- Draw the line dashed if the inequality is < or >.
- Pick a point not on the line to use as a test point.
- The point (0,0) is a good test point if it is not on the line.
- If the point makes the inequality true, shade that side of the line. If the point does not make the inequality true, shade the opposite side of the line.

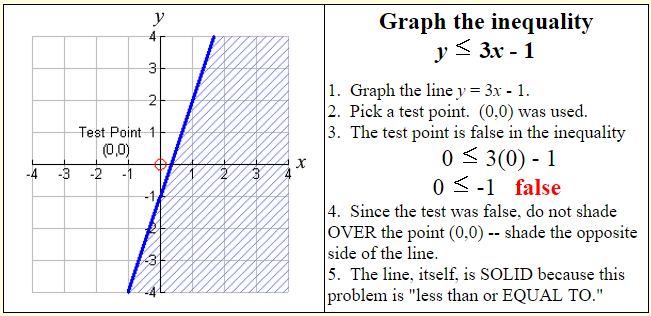
Example: Graph the following inequality y ≤ 3x – 1.