Graphically Represent the Inverse of a Function
Definition of an Inverse Relation:
If the graph of a function contains a point (a, b), then the graph of the inverse relation of the function contains the point (b, a). To graph the inverse of a function, reverse the ordered pairs of the original function.
Should the inverse relation of a function f (x) also be a function, this inverse function is denoted byf-1 (x)
“The x- and y- coordinates switch places!”
Note: The inverse of a function MAY NOT, itself, be a function.
If the inverse of a function is itself also a function, it is referred to as the inverse function.
Method 1: Determine graphically if a function has an inverse which is also a function:
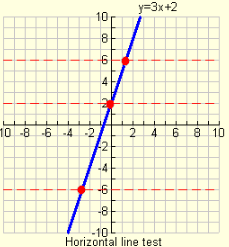
Use the horizontal line test to determine if a function has an inverse function.
If ANY horizontal line intersects your original function in ONLY ONE location, your function has an inverse which is also a function.
The function y = 3x + 2, shown at the right, HAS an inverse function because it passes the horizontal line test.
Method 2: Determine graphically if a function has an inverse which is also a function:
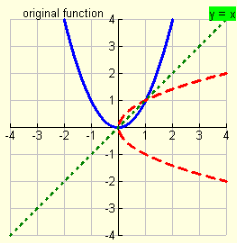
If a function has an inverse function, the reflection of that original function in the identity line, y = x, will also be a function (it will pass the vertical line test for functions).
The example at the left shows the original function,
y =x2 , in blue. Its reflection over the identity line
y = x is shown in red is its inverse relation. The red dashed line will not pass the vertical line test for functions, thus y = x2 does not have an inverse function.
You can see that the inverse relation exists, but it is NOT a function.
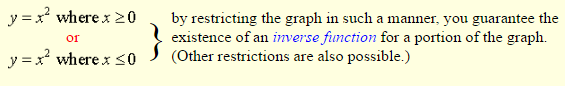
NOTE: With functions such as y =x2 , it is possible to restrict the domain to obtain an inverse function for a portion of the graph. This means that you will be looking at only a selected section of the original graph that will pass the horizontal line test for the existence of an inverse function.
For example:
The graph of (f o f-1) (x):
The graph of a function composed with its inverse function is the identity line y = x.