Line of Best Fit Using a Graphing Calculator
So which line is the REAL “line-of-best-fit”?
In the lesson on Line of Best Fit (without the graphing calculator), we discovered that finding the line-of-best-fit may lead to many “different” equations depending upon the points chosen to construct the line.
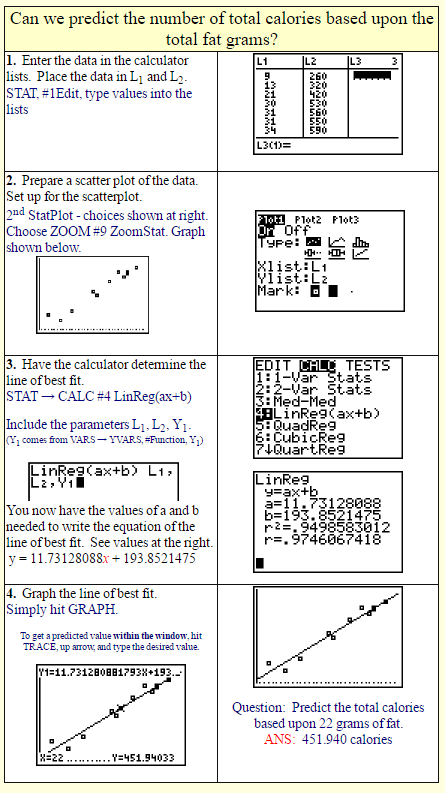
Simply stated, the graphing calculator has the capability of determining which line will actually represent the REAL line-of-best-fit.
The directions on this page were prepared using the TI-83+/TI-84+ graphing calculator.
Use of the graphing calculator will help you to better understand the concept of line of best fit.
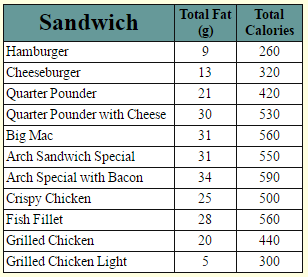
Let’s examine our fast food problem again with the use of the graphing calculator.
(This example and chart are from MathBits.com and were used with permission.)
Is there a relationship between the fat grams and the total calories in fast food?