Determining Relations and Functions
Relation: A relation is simply a set of ordered pairs.
A relation can be any set of ordered pairs.
No special rules need apply.
Consider this example of a relation:
The relationship between eye color and student names.
(x,y) = (eye color, student’s name)
Set A = {(green,Steve), (blue,Elaine), (brown,Kyle), (green,Marsha), (blue,Miranda), (brown, Dylan)}
Notice that the x-values (eye colors) get repeated.
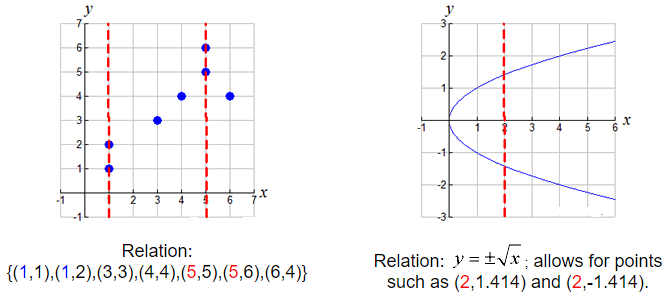
The scatter plot and the graph, shown below, are also examples of relations.
The thing to notice about them is that they also allow for one x-value
to have more than one corresponding y-value.
Points such as (1,1) and (1,2) can BOTH belong to the same relation.
If we impose the following rule on a relation, it becomes a function.
Function: A function is a set of ordered pairs in which each x-element has only ONE y-element associated with it.
While a function may NOT have two y-values assigned to the same x-value, it may have two x-values assigned to the same y-value.

Let’s adjust our previous examples so they fit the function “definition”.
If we remove duplicate eye colors,
the eye color example will be a function:
(x,y) = (eye color, student’s name)
Set B = {(blue,Steve), (green,Elaine), (brown,Kyle)}
Set B is a function.
And now the graphs:
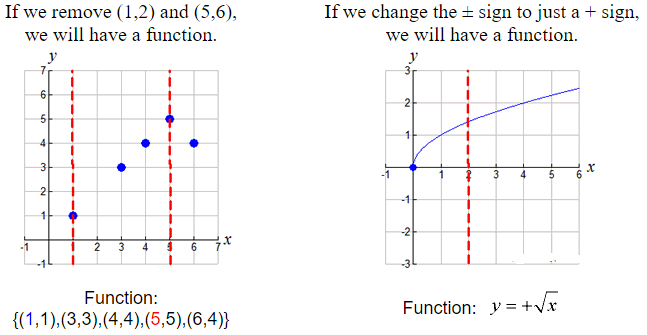
Notice that vertical lines on the graphs make it clear if an x-value had more than one y-value.
If the vertical lines intersected the graph in more than one location, we had a relation, NOT a function.
Example 1:
Given that relation A = {(4,3), (k,5), (7,-3), (3,2)}. Which of the following values for k will make relation A a function? a) 3 b) 4 c) 6
Solution: Choice c. The x-values of 3 and 4 are already used in relation A. If they are used again (with a different y-value), relation A will not be a function.
Example 2: Which of the following graphs represents a function?
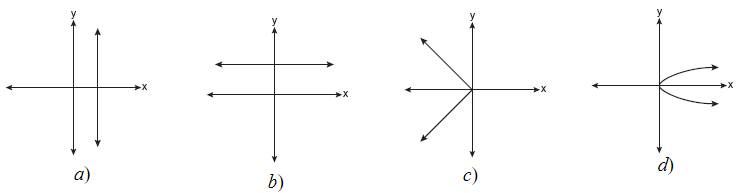
Solution: Choice b. A vertical line drawn on this graph will intersect the graph in only one location, making it a function. Vertical lines on the other three graphs will intersect the graph in more than one location, or as in part a, will intersect in an infinite number of points (all points).
Consider the following relations. Are they also functions?
Consider the relation described as:
(x, y) = (student’s name, shirt color)
This relation consists of {(Chico, gray), (Lynn, gray), (Paul, gray)}
This relation is also a function!
Now, let’s reverse the situation:
(x, y) = (shirt color, student’s name)
This relation consists of {(gray, Chico), (gray, Lynn), (gray, Paul)}
This relation is NOT a function!
If you are told that the student wearing the gray shirt wants to ask you a question, how will you know which student to approach?
Consider the relation described as:
(x, y) = (student’s name, shirt color)
This relation consists of {(Chico, gray), (Lynn, green), (Paul, red)}
This relation is also a function!
Now, let’s reverse the situation:
(x, y) = (shirt color, student’s name)
This relation consists of {(gray, Chico), (green, Lynn), (red, Paul)}
This relation is also a function!
In this situation, if you are told that the student wearing the gray shirt wants to ask you a question, you will know that the student is Chico.
Functional Notation:
Traditionally, functions are referred to by the notation f (x), which is read “f of x” or “f as a function of x”. (The parentheses do not mean “multiplication”.)
For example, since y = 3x + 7 is a function, it may also be written as f (x) = 3x + 7.
The letter f need not be the only letter used, however, in function names. Function names may also be g(x), h(x), A(x), C(a), or any letters that clearly identify the function being used.
Example: A function is represented by f (x) = 2x + 5. Find f (3).
To find f (3), replace the x-value with 3.
f (3) = 2(3) + 5 = 11.
The answer, 11, is called the image of 3 under f (x).
Note: The f (x) notation can be thought of as another way of representing the y-value in a function, especially when graphing. The y-axis if even labeled as the f (x) axis, when graphing.