Sinusoidal Graphs: y = A sin(B(x – C)) + D
A sine wave, or sinusoid, is the graph of the sine function in trigonometry.
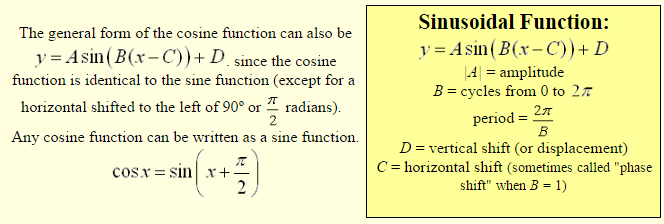
A sinusoid is the name given to any curve that can be written in the form
(A and B are positive).
Sinusoids are considered to be the general form of the sine function.
In addition to mathematics, sinusoidal functions occur in other fields of study such as science and engineering. This function also occurs in nature as seen in ocean waves, sound waves and light waves. Even average daily temperatures for each day of the year resemble this function. The term sinusoid was first use by Scotsman Stuart Kenny in 1789 while observing the growth and harvest of soybeans.
Let’s start with an investigation of the simpler graphs of
y = A sin(Bx) and y = A cos(Bx).
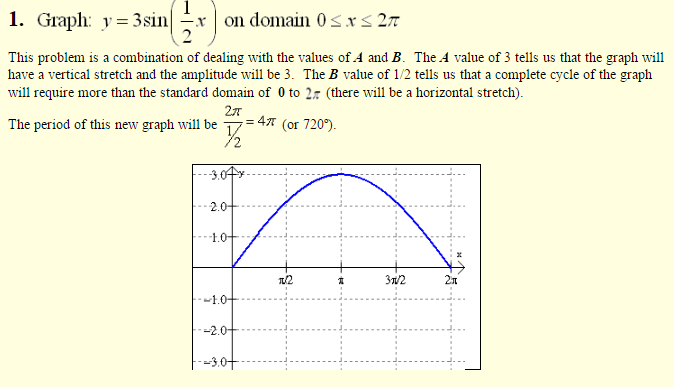
What affect does the value A have on the graph?
y = A sin(Bx) or y = A cos(Bx)
A number in front of sine or cosine changes the height of the graph.
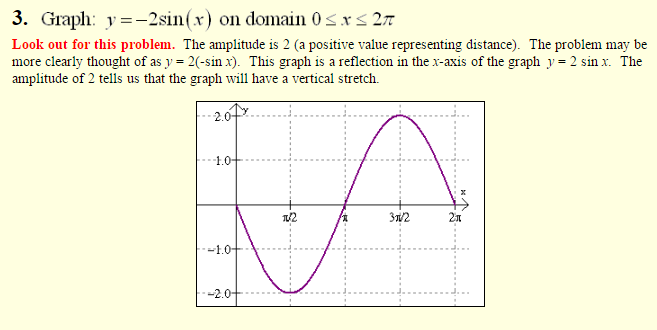
The value A affects the amplitude. The amplitude (half the distance between the maximum and minimum values of the function) will be |A|, since distance is always positive. Increasing or decreasing the value of A will vertically stretch or shrink the graph. Consider these examples:
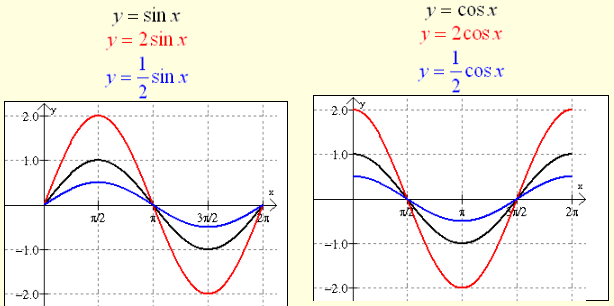
Notice: These graphs change “height” but do not change horizontal width.
The graphs are still drawn from 0 to .
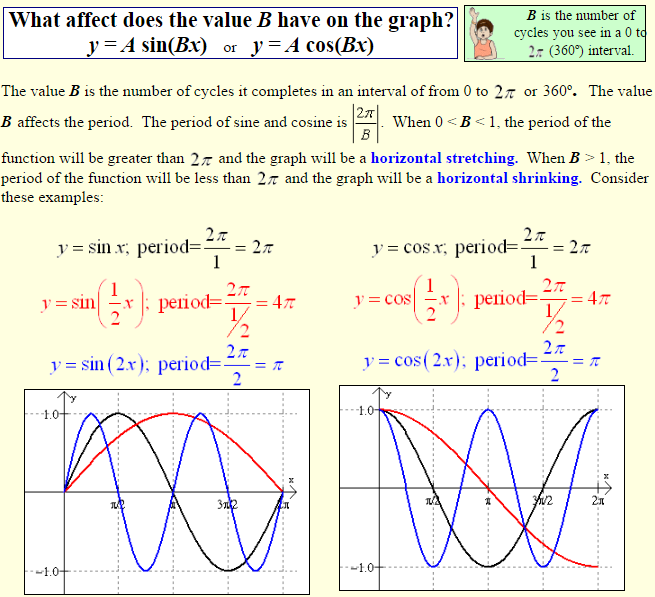
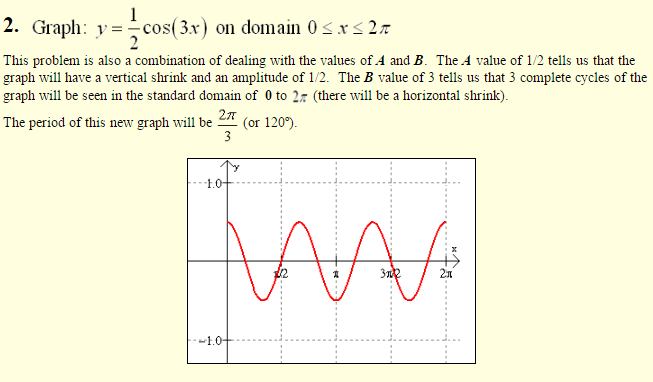
Notice: These graphs change horizontal “width” but do not change height. The two red graphs only show us a portion (in this example “half”) of the original graphs in their 0 to windows. We would need to “stretch” the domain window to to see entire cycles of those two graphs. Whereas the two blue graphs show us two complete cycles of the graphs in their 0 to windows, which would allow us to “shrink” the domain window and still see complete cycles of the graphs.
Examples: