Solving a Linear Quadratic System Graphically
The graphing method of solution:
Quadratic equations can also be solved by graphing. Graphing can be done “by hand” or with the use of a graphing calculator. The locations where the graph intersects (crosses) the x-axis will be the solutions to the equation. These locations are called the roots of the equation.
(At the Algebra 1 level, the quadratic graphs will always intersect the x-axis.)
Let’s take a look at chart graphing for a quadratic function.
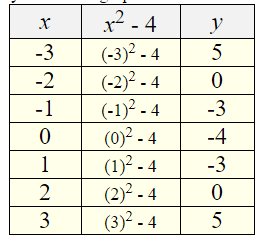
Graph y = x2 – 4:
A chart is prepared using both positive and negative values for x. Since we were not given any information as to what values of x to use in the chart, we are “guessing” at which values will tell us the entire story about this graph.
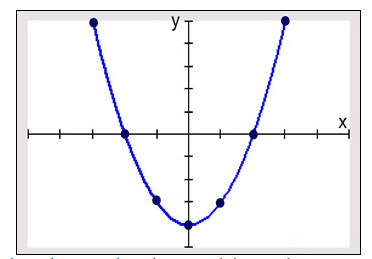
The points are plotted to reveal the graph. Be sure to draw a “smooth” curved graph. Do not play “connect the dots” by drawing straight line segments between the points. There are no straight line segments in a parabola, as its slope is never constant.