Selina Concise Mathematics Class 10 ICSE Solutions Graphical Representation (Histograms, Frequency Polygon and Ogives)
Selina Publishers Concise Mathematics Class 10 ICSE Solutions Chapter 23 Graphical Representation (Histograms, Frequency Polygon and Ogives)
Graphical Representation Exercise 23 – Selina Concise Mathematics Class 10 ICSE Solutions
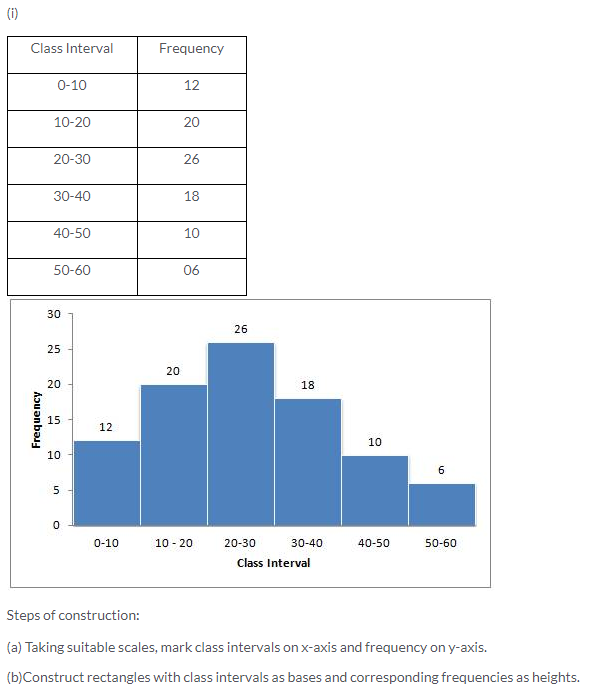
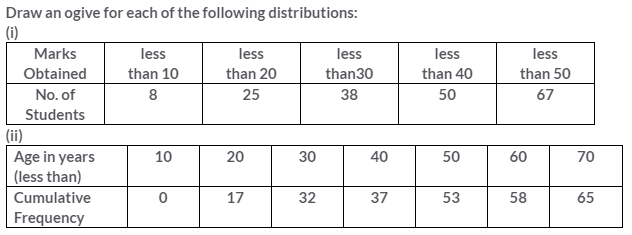
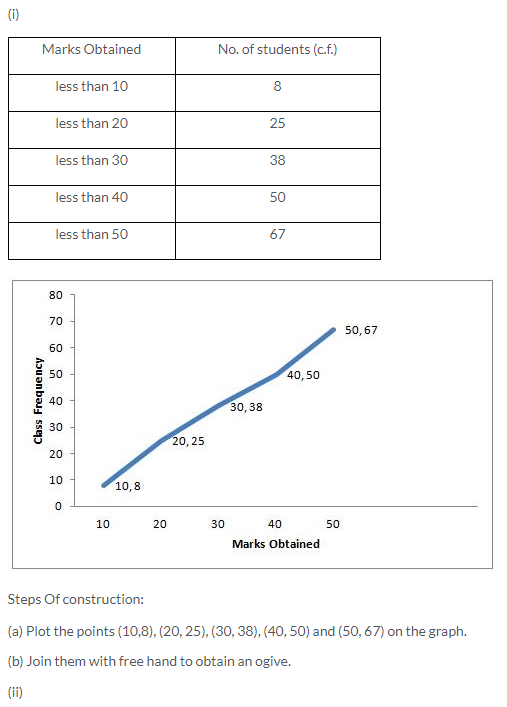
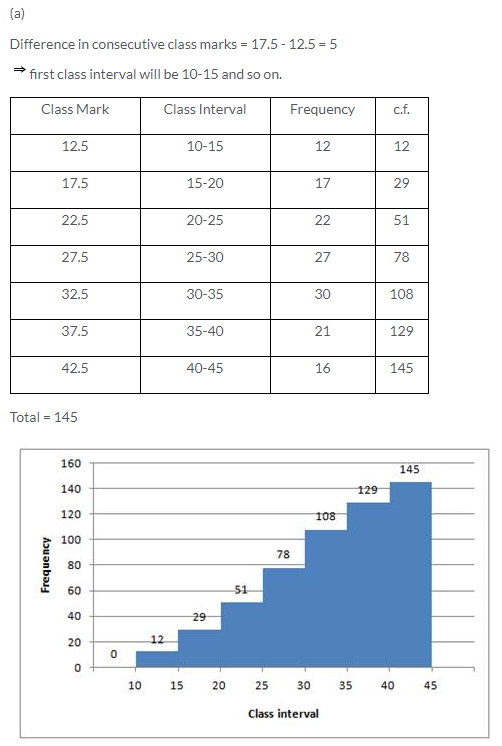
Question 1.
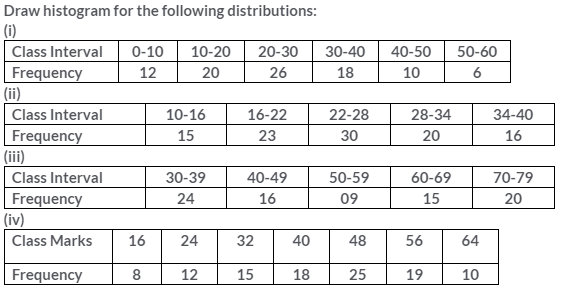
Solution:
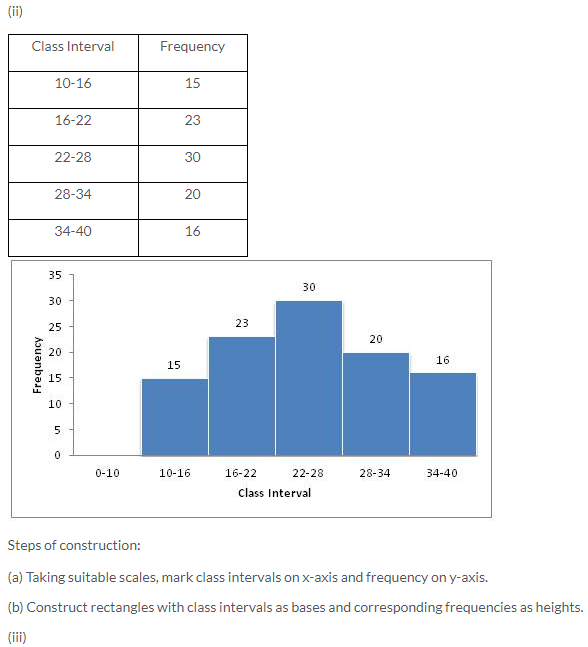
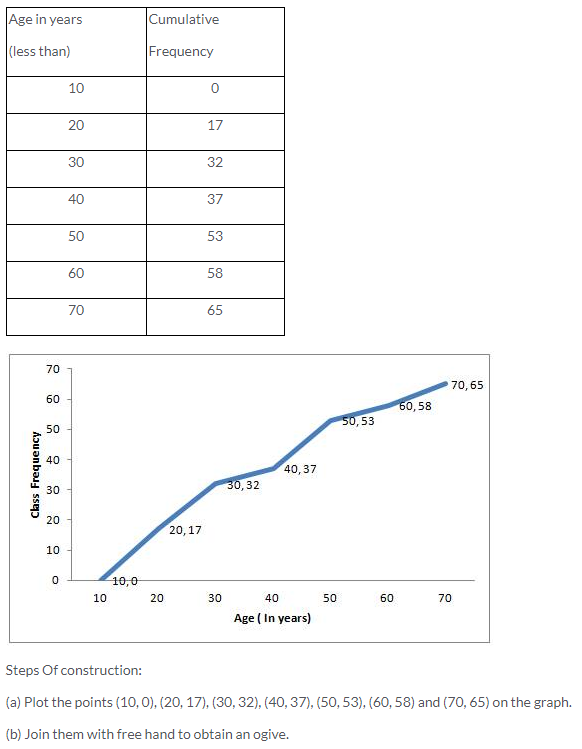
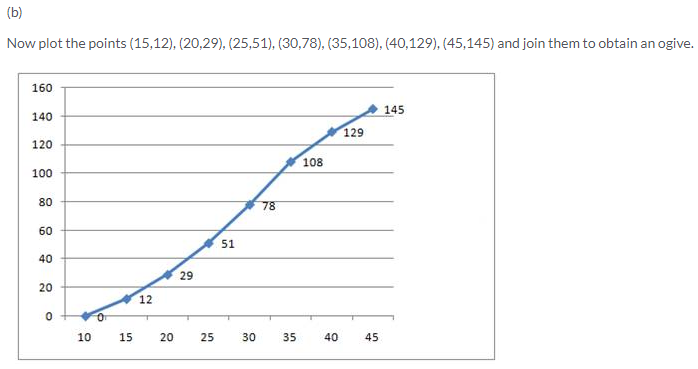
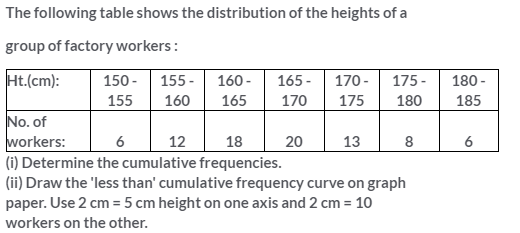
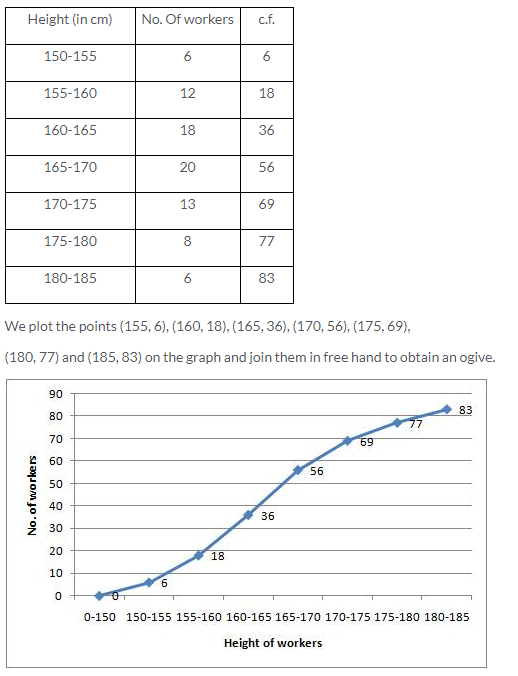
Question 2.
Solution:
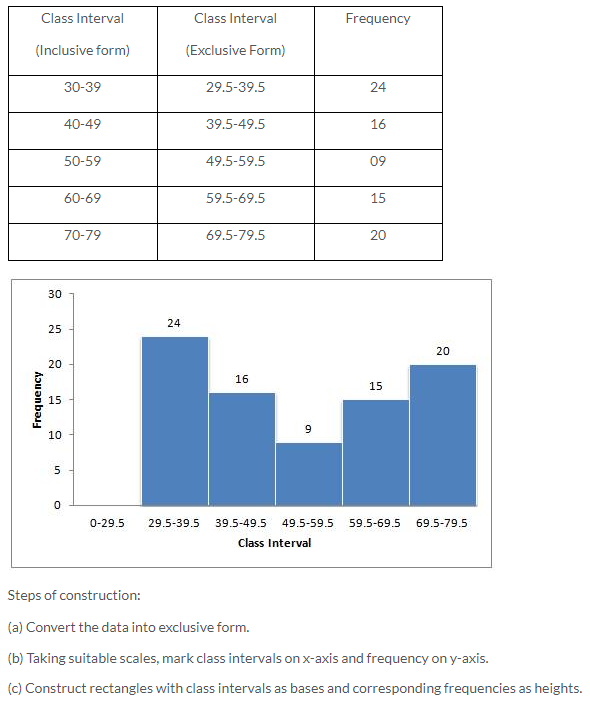
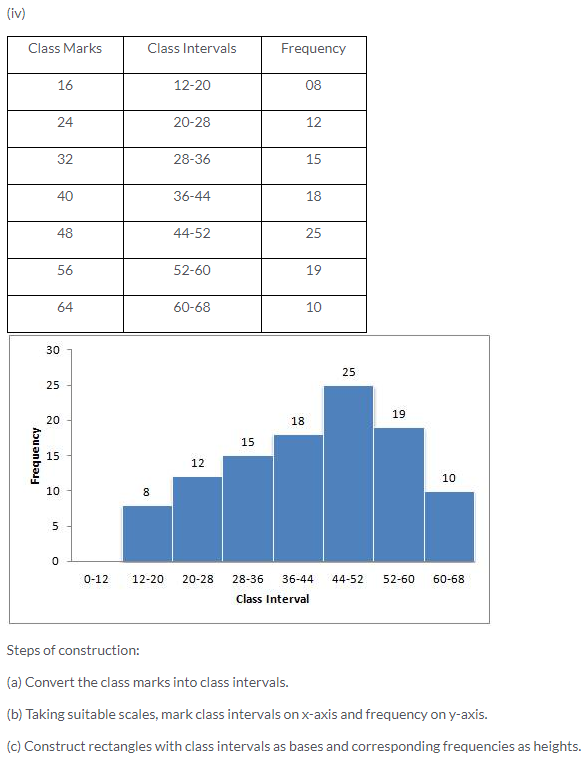
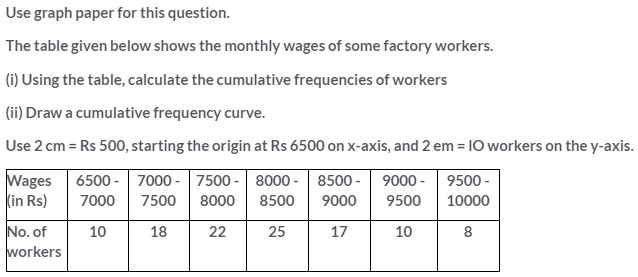
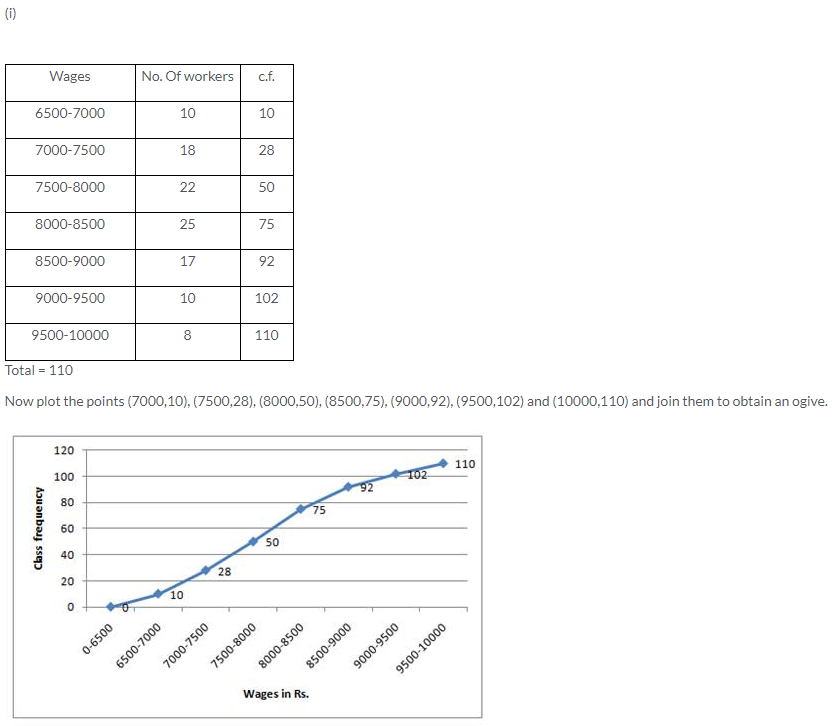
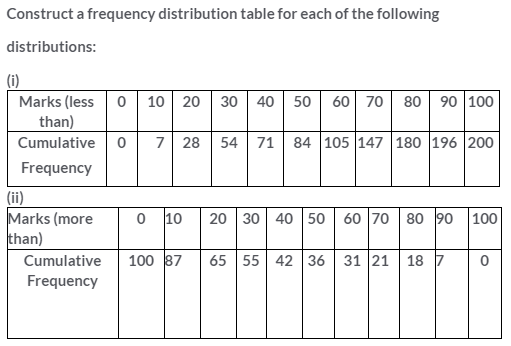
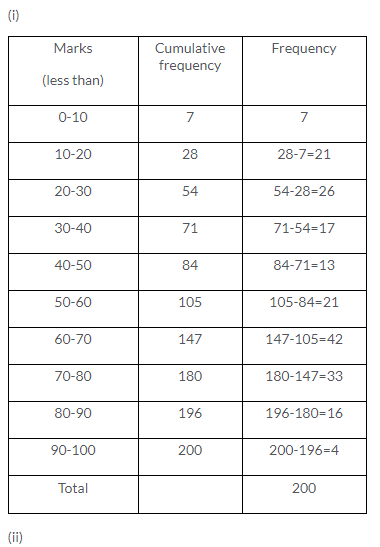
Question 3.
Solution:
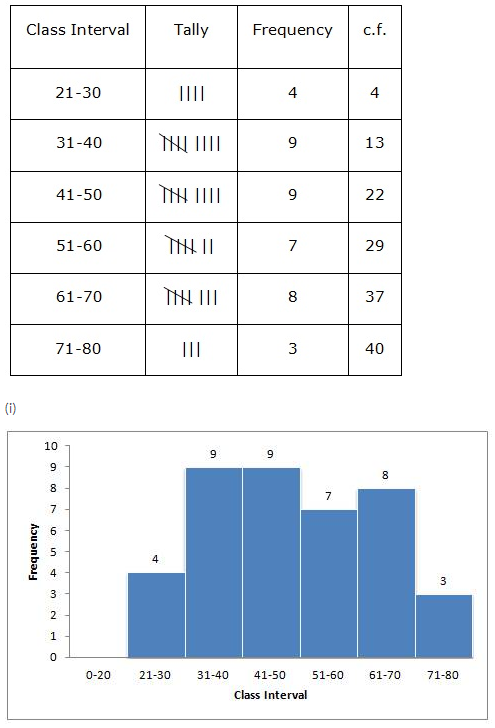
Question 4.
Construct a frequency distribution table for the number given below, using the class intervals 21-30, 31-40 … etc.
75, 67, 57, 50, 26, 33, 44, 58, 67, 75, 78, 43, 41, 31, 21, 32, 40, 62, 54, 69, 48, 47, 51, 38, 39, 43, 61, 63, 68, 53, 56, 49, 59, 37, 40, 68, 23, 28, 36, 47
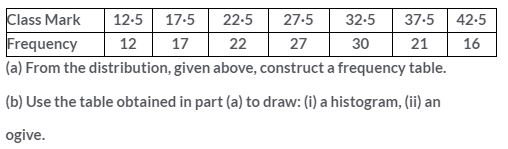
Use the table obtained to draw:
(i) a histogram (ii) an ogive
Solution:
Question 5.
Solution:
Question 6.
Solution:
Question 7.
Solution:
Question 8.
Solution:
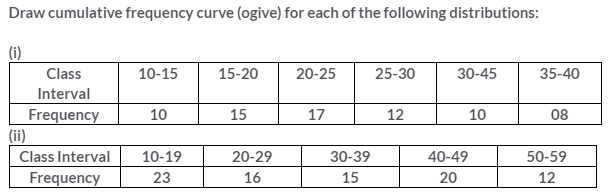
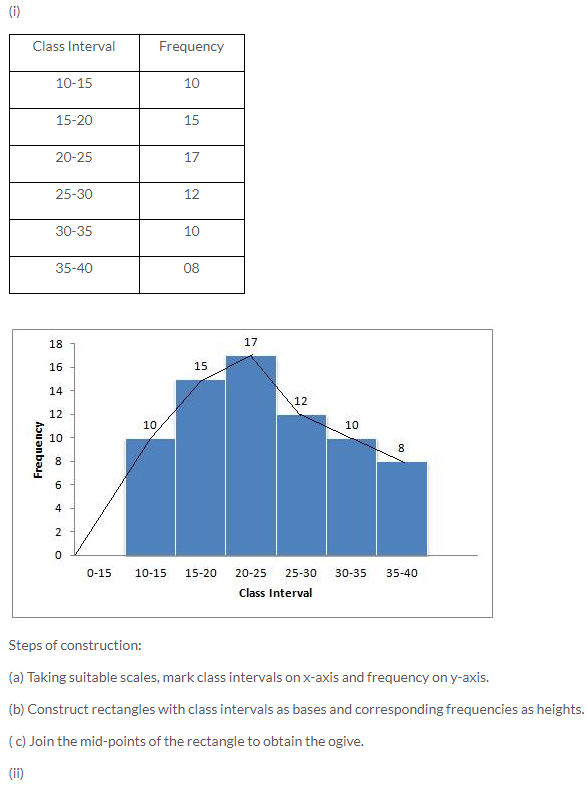
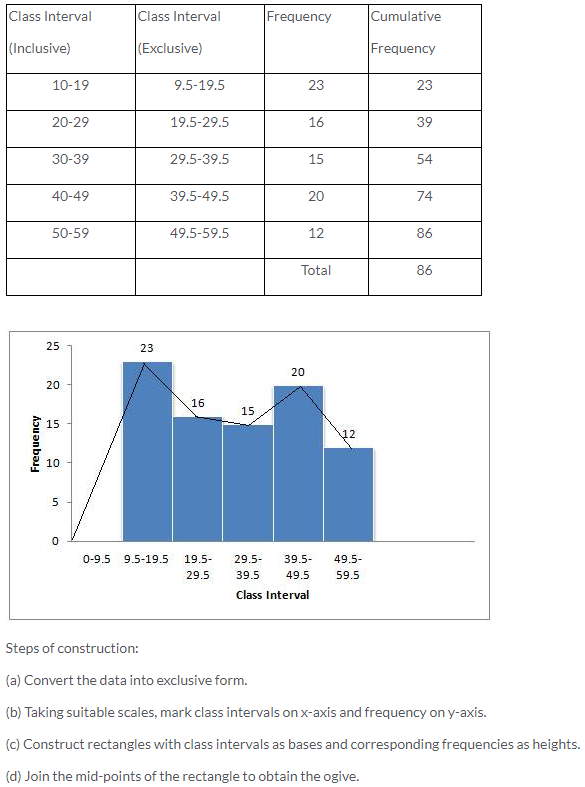
Question 9.
Solution:
More Resources for Selina Concise Class 10 ICSE Solutions