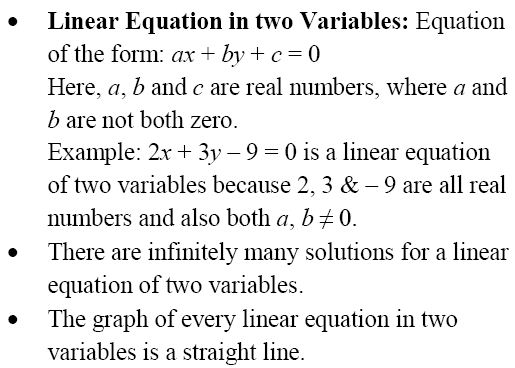
RS Aggarwal Solutions Class 9 Chapter 8 Linear Equations in Two Variables
Exercise 8A
Question 1:
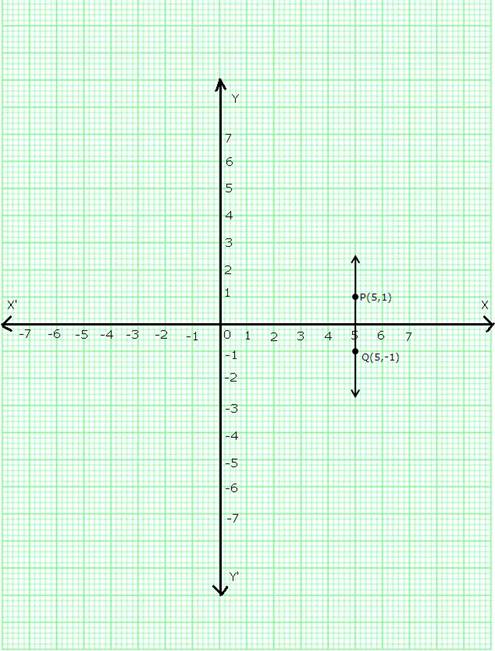
(i) The given equation is x = 5
Take two solutions of the given equation as x = 5, y = 1 and x = 5, y = -1
Thus we get the following table:
Plot points P(5,1) and Q(5,-1) on the graph paper.
Join PQ. The line PQ is the required graph.
Read More:
- What is a Linear Equation
- Linear Equations In One Variable
- Linear Equations In Two Variables
- Graphical Method Of Solving Linear Equations In Two Variables
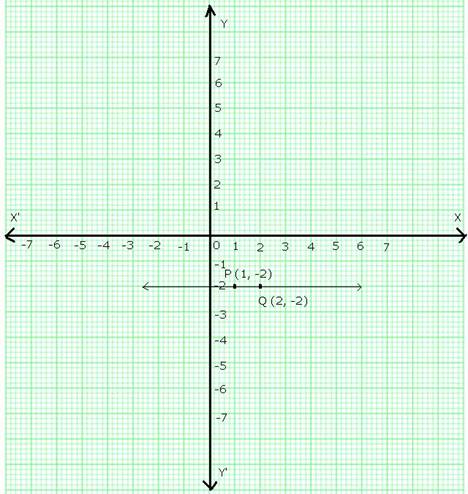
(ii) The given equation is y = -2
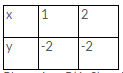
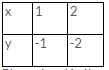
Take two solutions of the given equation as x = 1, y = -2 and x = 2, y = -2.
Thus we have the following table:
Plot points P(1,-2) and Q(2,-2) on the graph paper. Join PQ. The line PQ is the required graph.
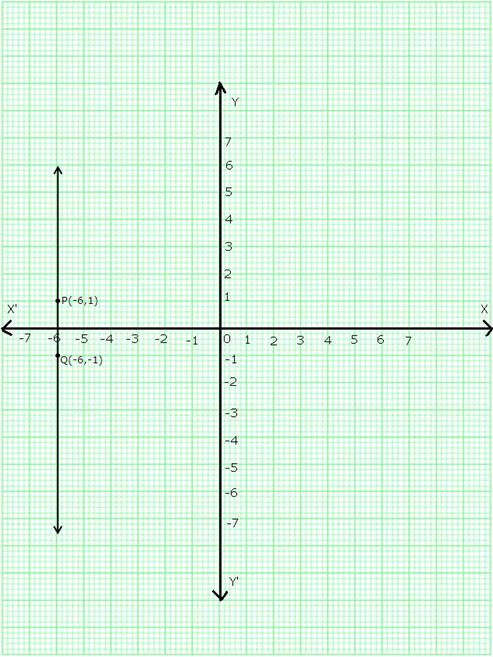
(iii) The given equation is
x + 6 = 0
⇒ x = -6
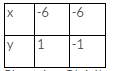
Let x = -6 & y = 1
x = -6 & y = -1
Plot points P(-6,1) and Q(-6,-1) on the graph paper. Join PQ. The line PQ is the required graph.
(iv) The given equation is
x + 7 = 0
⇒ x = -7
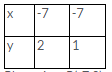
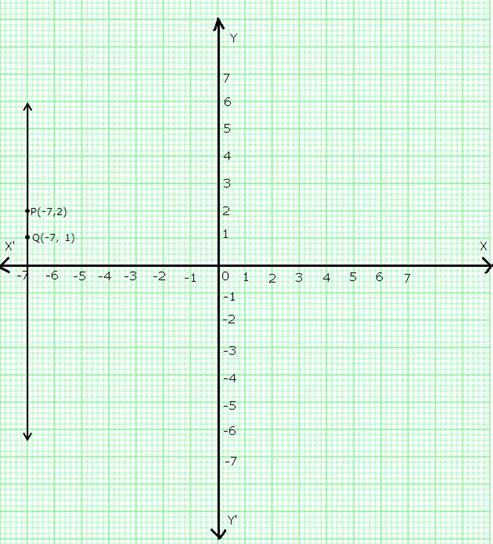
Let x = -7, y = 2 and x = -7, y = 1
Thus we have the following table:
Plot points P(-7,2) and Q(-7,1) on the graph paper. Join PQ. The line PQ is the required graph.
(v) y = 0 represents the x-axis
(vi) x = 0 represents the y-axis.
Question 2:
The given equation is y = 3x.
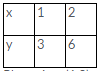
Putting x = 1, y = 3 (1) = 3
Putting x = 2, y = 3 (2) = 6
Thus, we have the following table:
Plot points (1,3) and (2,6) on a graph paper and join them to get the required graph.
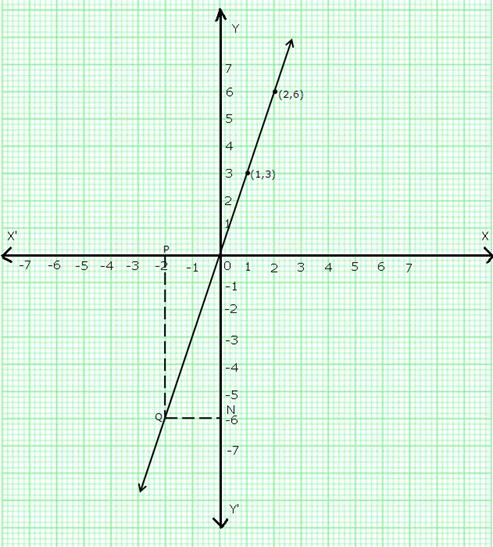
Take a point P on the left of y-axis such that the distance of point P from the y-axis is 2 units.
Draw PQ parallel to y-axis cutting the line y = 3x at Q. Draw QN parallel to x-axis meeting y-axis at N.
So, y = ON = -6.
Question 3:
The given equation is,
x + 2y – 3 = 0
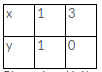
⇒ x = 3 – 2y
Putting y = 1, x = 3 – (2 × 1) = 1
Putting y = 0, x = 3 – (2 × 0) = 3
Thus, we have the following table:
Plot points (1,1) and (3,0) on a graph paper and join them to get the required graph.
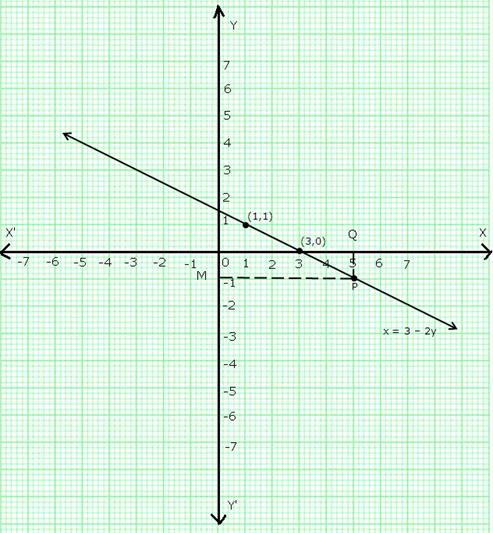
Take a point Q on x-axis such that OQ = 5.
Draw QP parallel to y-axis meeting the line (x = 3 – 2y) at P.
Through P, draw PM parallel to x-axis cutting y-axis at M.
So, y = OM = -1.
Question 4:
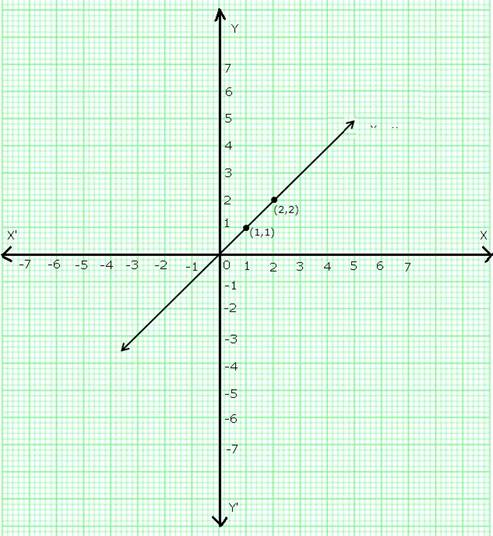
(i) The given equation is y = x
Let x = 1, then y = 1 and let x = 2, then y = 2
Thus, we have the following table:
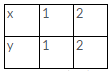
Plot points (1,1) and (2,2) on a graph paper and join them to get the required graph.
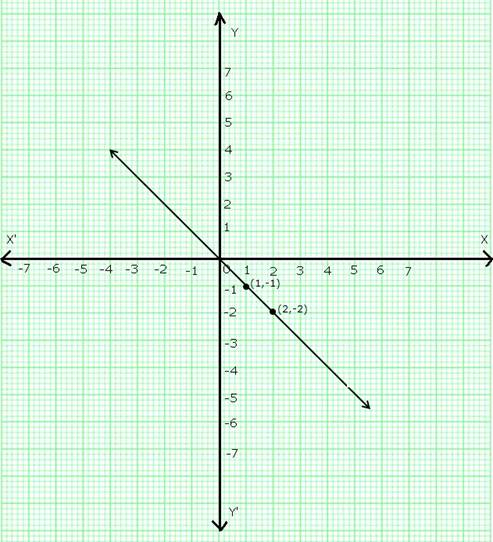
(ii) The given equation is y = -x
Now, if x = 1, y = -1 and if x = 2, y = -2
Thus, we have the following table:
Plot points (1,-1) and (2,-2) on a graph paper and join them to get the required graph.
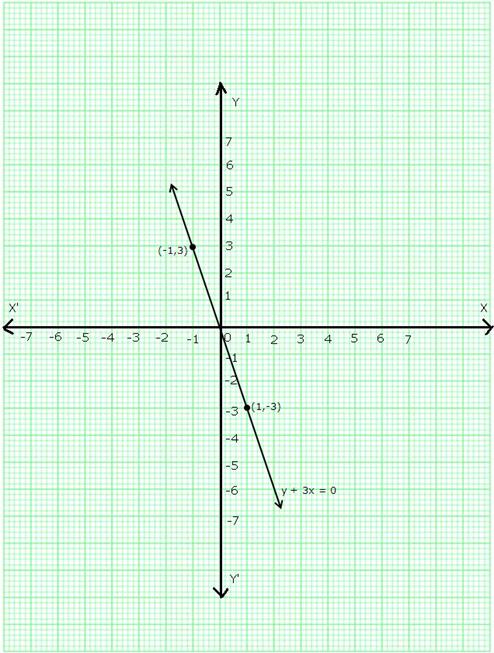
(iii) The given equation is y + 3x = 0
⇒ y = -3x
Now, if x = -1, then y = -3 (-1) = 3
And, if x = 1, then y = -3 (1) = -3
Thus we have the following table:
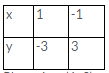
Plot points (1,-3) and (-1,3) on a graph paper and join them to get the required graph.
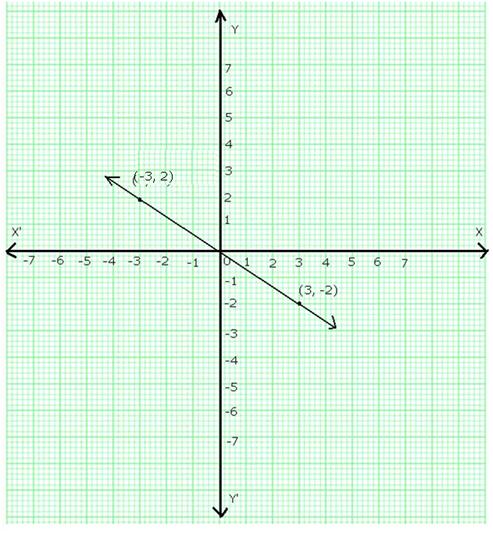
(iv) The given equation is 2x + 3y = 0
⇒ y = \(\frac { -2 }{ 3 } \) x
Now, if x = 3, then
y = \(\frac { -2 }{ 3 } \) × 3 = -2
And, if x = -3, then
y = \(\frac { -2 }{ 3 } \) × (-3) = 2
Thus, we have the following table
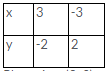
Plot points (3,-2) and (-3,2) on a graph paper and join them to get the required graph.
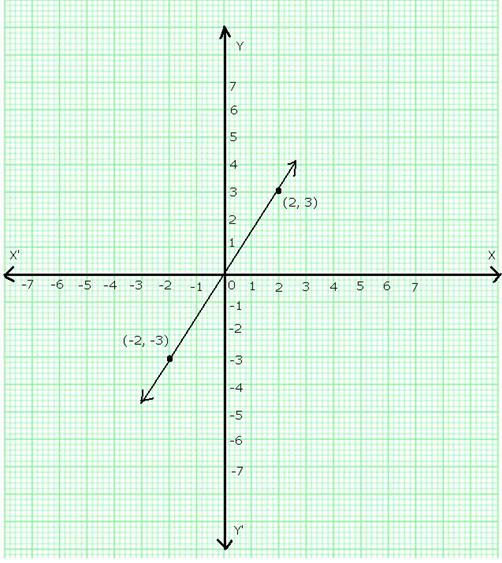
(v) The given equation is 3x – 2y = 0
⇒ y = \(\frac { 3 }{ 2 } \) x
Now, if x = 2,
y = \(\frac { 3 }{ 2 } \) × 2 = 3
And, if x = -2,
y = \(\frac { 3 }{ 2 } \) × (-2) = -3
Thus, we have the following table:
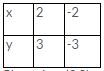
Plot points (2,3) and (-2,-3) on a graph paper and join them to get the required graph.
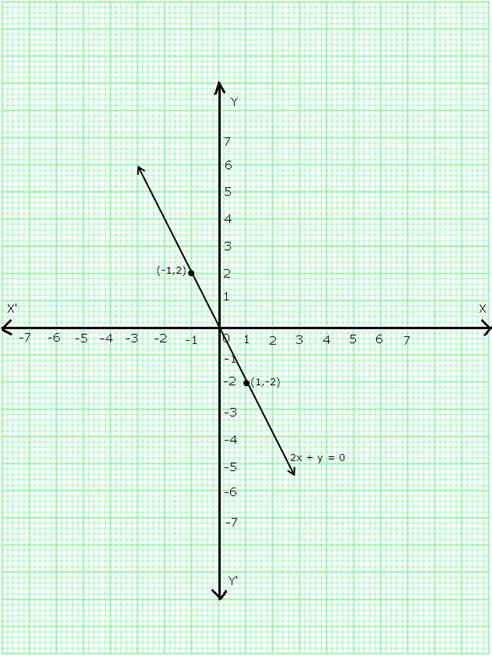
(vi) The given equation is 2x + y = 0
⇒ y = -2x
Now, if x = 1, then y = -2 1 = -2
And, if x = -1, then y = -2 (-1) = 2
Thus, we have the following table:
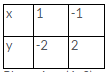
Plot points (1,-2) and (-1,2) on a graph paper and join them to get the required graph.
Question 5:
The given equation is, 2x – 3y = 5
⇒ y = \(\frac { 2x-5 }{ 3 } \)
Now, if x = 4, then
\(y=\frac { 2(4)-5 }{ 3 } =\frac { 8-5 }{ 3 } =1 \)
And, if x = -2, then
\(y=\frac { 2(-2)-5 }{ 3 } =\frac { -4-5 }{ 3 } =\frac { -9 }{ 3 } =-3 \)
Thus, we have the following table:
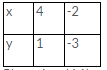
Plot points (4,1) and (-2,-3) on a graph paper and join them to get the required graph.
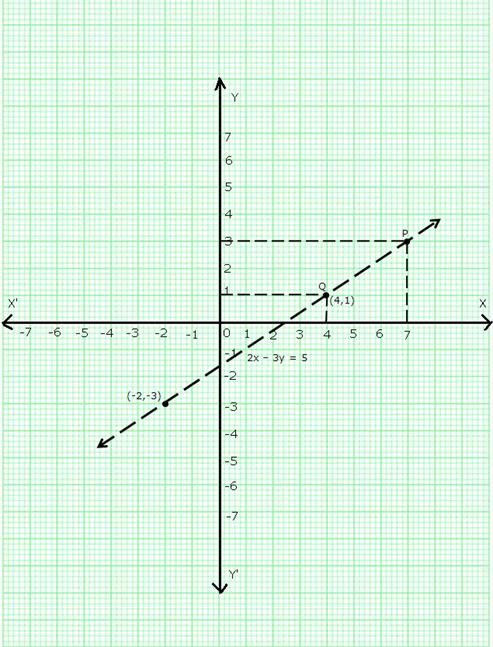
(i) When x = 4, draw a line parallel to y-axis at a distance of 4 units from y-axis to its right cutting the line at Q and through Q draw a line parallel to x-axis cutting y-axis which is found to be at a distance of 1 units above x-axis.
Thus, y = 1 when x = 4.
(ii) When y = 3, draw a line parallel to x-axis at a distance of 3 units from x-axis and above it, cutting the line at point P. Through P, draw a line parallel to y-axis meeting x-axis at a point which is found be 7 units to the right of y axis.
Thus, when y = 3, x = 7.
Question 6:
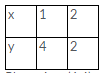
The given equation is 2x + y = 6
⇒ y = 6 – 2x
Now, if x = 1, then y = 6 – 2 (1) = 4
And, if x = 2, then y = 6 – 2 (2) = 2
Thus, we have the following table:
Plot points (1,4) and (2,2) on a graph paper and join them to get the required graph.
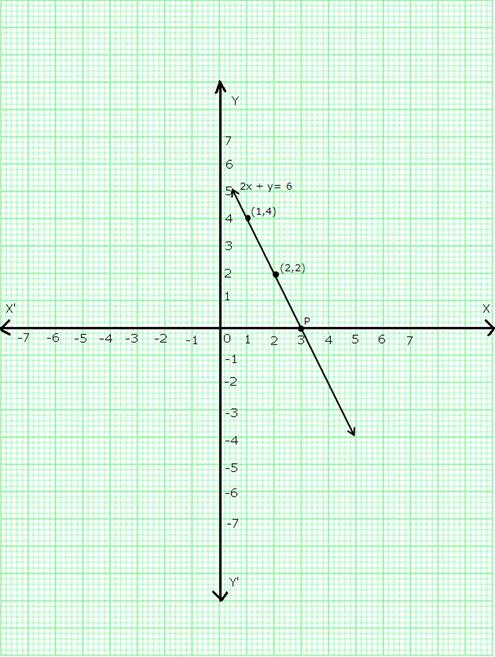
We find that the line cuts the x-axis at a point P which is at a distance of 3 units to the right of y-axis.
So, the co-ordinates of P are (3,0).
Question 7:
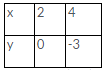
The given equation is 3x + 2y = 6
⇒ 2y = 6 – 3x
⇒ y = \(\frac { 6-3x }{ 2 } \)
Now, if x = 2, then
\(y=\frac { 6-3(2) }{ 2 } = 0 \)
And, if x = 4, then
\(y=\frac { 6-3(4) }{ 2 } =\frac { -6 }{ 2 } = -3 \)
Thus, we have the following table:
Plot points (2, 0) and (4,-3) on a graph paper and join them to get the required graph.
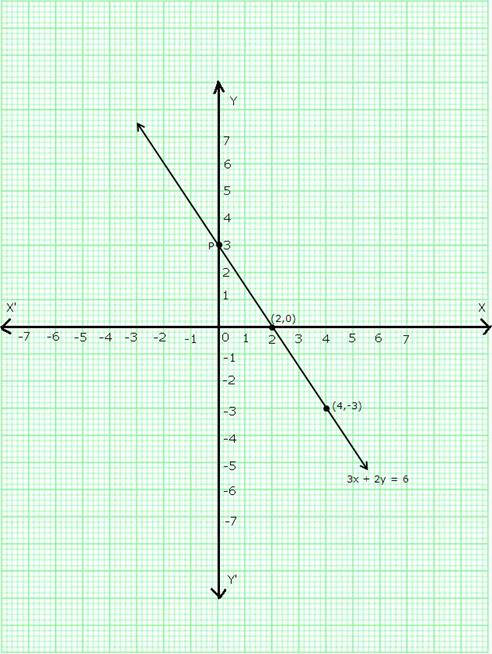
We find that the line 3x + 2y = 6 cuts the y-axis at a point P which is 3 units above the x-axis.
So, co-ordinates of P are (0,3).