RS Aggarwal Solutions Class 9 Chapter 14 Statistics
Exercise 14A
Question 1:
Statistics is a branch of science which deals with the collection, presentation, analysis and interpretation of numerical data.
Question 2:
Fundamental characteristics of statistics :
(i) It deals only with the numerical data.
(ii) Qualitative characteristic such as illiteracy, intelligence, poverty etc cannot be measured numerically
(iii) Statistical inferences are not exact.
Question 3:
Primary data: Primary data is the data collected by the investigator himself with a definite plan in his mind. These data are very accurate and reliable as these being collected by the investigator himself.
Secondary Data: Secondary data is the data collected by a person other than the investigator.
Secondary Data is not very reliable as these are collected by others with purpose other than the investigator and may not be fully relevant to the investigation.
Question 4:
(i)Variate : Any character which can assume many different values is called a variate.
(ii) Class Interval :Each group or class in which data is condensed is called a class interval.
(iii) Class-Size : The difference between the true upper limit and the true lower limit of a class is called class size.
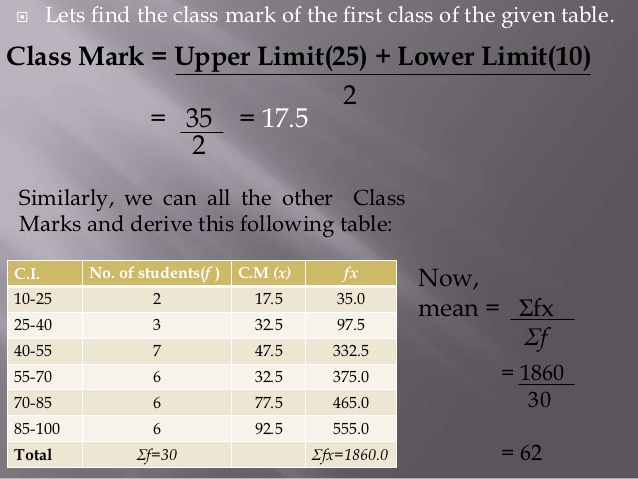
(iv) Class-mark : The average of upper and lower limit of a class interval is called its class mark.
i.e Class mark = \(\frac { upper\quad limit\quad +\quad lower\quad limit }{ 2 } \)
(v) Class limit: Class limits are the two figures by which a class is bounded . The figure on the left side of a class is called lower lower limit and on the right side is called its upper limit.
(vi) True class limits : In the case of exclusive form of frequency distribution, the upper class limits and lower class limits are the true upper limits and the true lower limits. But in the case of inclusive form of frequency distribution , the true lower limit of a class is obtained by subtracting 0.5 from the lower limit of the class. And the true upper limit of the class is obtained by adding 0.5 to the upper limit.
(vii) Frequency of a class : The number of observations falling in a class determines its frequency.
(viii) Cumulative frequency of a class: The sum of all frequencies up to and including that class is called , the cumulative frequency of that class.
Read More:
- Classmark and Discrete Frequency Distribution
- Cumulative Frequency in statistics
- Cumulative Frequency Curve or the Ogive in Statistics
Question 5:
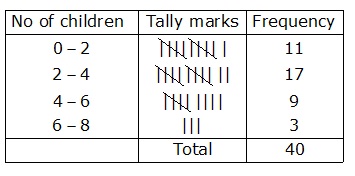
Minimum observation is 0 and maximum observation is 6. The classes of equal size covering the given data are : (0-2), (2-4), (4-6) and (6-8).
Thus , the frequency distribution may be given as under:
Question 6:
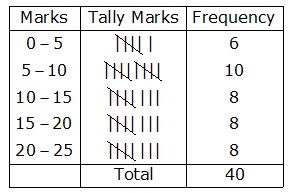
Minimum observation is 1 and minimum observation is 24. The classes of equal size converging the given data are : (0-5), (5-10), (10-15), (15-20), (20-25)
Thus, the frequency distribution may be given as under :
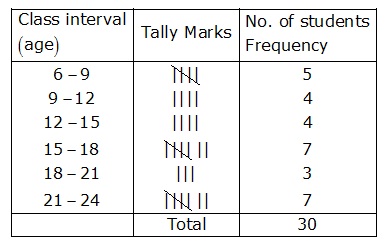
Question 7:
Minimum observation is 6 and maximum observation is 23 .So the range is 23-6=17
The classes of equal size covering the given data are : (6-9), (9-12) , (12-15) , (15-18 ), (18-21), (21-24) ,
Thus the frequency distribution may be given as under :
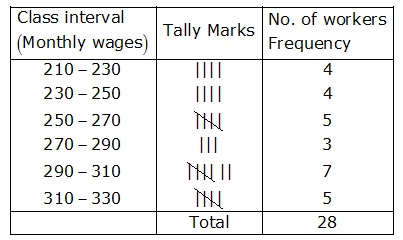
Question 8:
Minimum observation is 210 and maximum observation =320
So the range is (320-210)=110
The classes of equal size covering the given data are :
(210-230), (230-250), (250-270) , (270-290), (290-310), (310-330)
Thus the frequency distribution may be given as under :
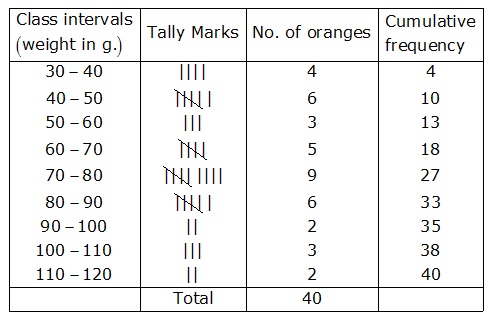
Question 9:
Minimum observation is 30 and maximum observation is 110
So, range is 100-30=80
The classes of equal size covering the given data are :
(30-40) ,(40-50) , (50-60) ,(60-70) , (70-80), (80-90),(90-100),(100-110), (110-120)
Thus , the frequency and cumulative frequency table may be given as under :
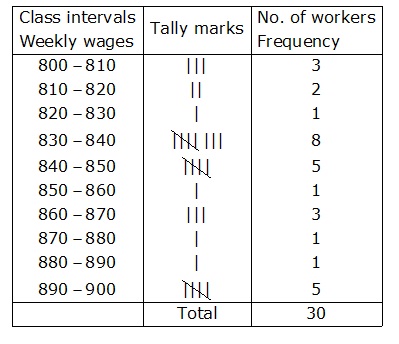
Question 10:
Minimum observations is 804 and maximum observation is 898 So, range is 898-804 =94
The class es of equal size covering the given data are :
(800-810), (810-820) , (820-830),(840-850), (850-860), (860-870), (870-880) ,(880-890), (890-900)
Thus the frequency table may be given as under :
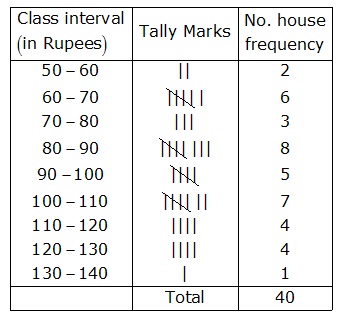
Question 11:
Minimum observation 52 and maximum observation is 130
So , The range is 130-52=78
The classes of equal size covering the given data are :
(50-60), (60-70), (70-80), (80-90), (90-100), (100-110), (110-120), (120-130),(130-140)
Thus , the frequency table may be given as under :
Question 12:
| Age (in years) | Number of Patients (Frequency) | Cumulative Frequency |
| 10 – 20 | 90 | 90 |
| 20 – 30 | 50 | 140 |
| 30 – 40 | 60 | 200 |
| 40 – 50 | 80 | 280 |
| 50 – 60 | 50 | 330 |
| 60 – 70 | 30 | 360 |
| Total | 360 |
Question 13:
Marks(below) | Number of students (Cumulative Frequency) | Class Intervals | Frequency |
10 | 5 | 0 – 10 | 5 |
20 | 12 | 10 – 20 | 12 – 5 = 7 |
30 | 32 | 20 – 30 | 32 – 12 = 20 |
| 40 | 40 | 30 – 40 | 40 – 32 = 8 |
50 | 45 | 40 – 50 | 45 – 40 = 5 |
| 60 | 48 | 50 – 60 | 48 – 45 = 3 |
| Total | 48 |
Question 14:
Marks(below) | Number of students (Cumulative Frequency) | Class Intervals | Frequency |
10 | 17 | 0 – 10 | 17 |
20 | 22 | 10 – 20 | 22 – 17 = 5 |
30 | 29 | 20 – 30 | 29 – 22 = 7 |
| 40 | 37 | 30 – 40 | 37 – 29 = 8 |
50 | 50 | 40 – 50 | 50 – 37 = 13 |
| 60 | 60 | 50 – 60 | 60 – 50 = 10 |
| Total | 60 |
Question 15:
Marks(below) | Number of students (Cumulative Frequency) | Class Intervals | Frequency |
More than 60 | 0 | More than 60 | 0 |
More than 50 | 16 | 50 – 60 | 16-0=16 |
More than 40 | 40 | 40 – 50 | 40-16=24 |
| More than 30 | 75 | 30 – 40 | 75-40=35 |
More than 20 | 87 | 20 – 30 | 87-75=12 |
| More than 10 | 92 | 10 – 20 | 92-87=5 |
More than 0 | 100 | 0 – 10 | 100-92=8 |
| Total | 100 |
Exercise 14B
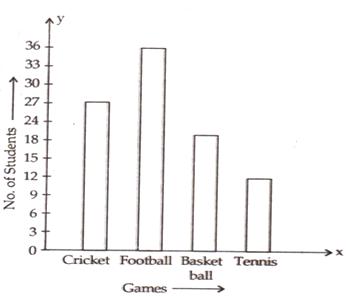
Question 1:
Take the various types of games along the x-axis and the number of students along the y-axis.
Along the y-axis, take 1 small square=3 units.
All the bars should be of same width and same space should be left between the consecutive bars.
Now we shall draw the bar chart, as shown below:
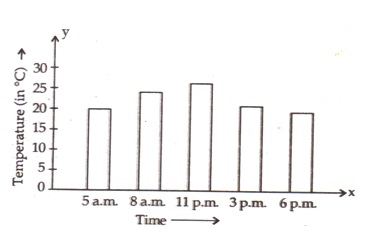
Question 2:
Take the timings along the x-axis and the temperatures along the y-axis.
Along the y-axis, take 1 small square=5 units.
All the bars should be of same width and same space should be left between the consecutive bars.
Now we shall draw the bar chart, as shown below:
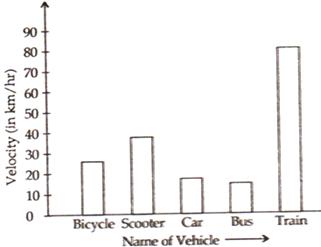
Question 3:
Take the modes of transport along the x-axis and the velocities along the y-axis.
Along the y-axis, take 1 small square=10 units.
All the bars should be of same width and same space should be left between the consecutive bars.
Now we shall draw the bar chart, as shown below:
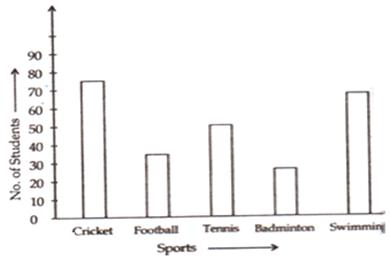
Question 4:
Take the various types of sports along the x-axis and the number of students along the y-axis.
Along the y-axis, take 1 small square=10 units.
All the bars should be of same width and same space should be left between the consecutive bars.
Now we shall draw the bar chart, as shown below:
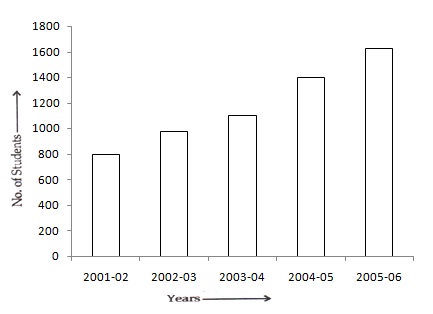
Question 5:
Take the academic year along the x-axis and the number of students along the y-axis.
Along the y-axis, take 1 big division =200 units.
All the bars should be of same width and same space should be left between the consecutive bars.
Now we shall draw the bar chart, as shown below:
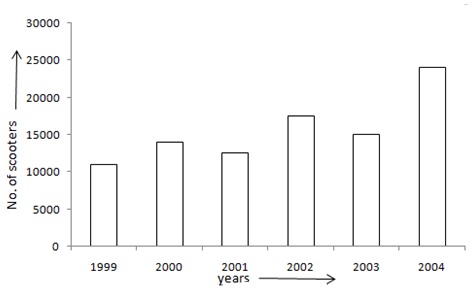
Question 6:
Take the years along the x-axis and the number of scooters along the y-axis.
Along the y-axis, take 1 big division =5000 units.
All the bars should be of same width and same space should be left between the consecutive bars.
Now we shall draw the bar chart, as shown below:
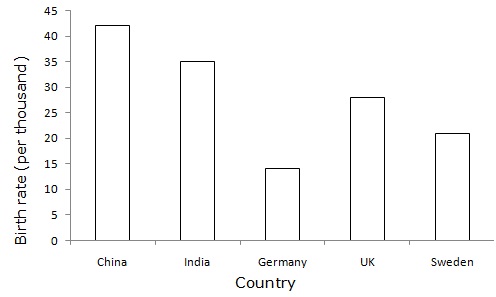
Question 7:
Take the countries along the x-axis and the birth rate (per thousand) along the y-axis.
Along the y-axis, take 1 big division = 5 units.
All the bars should be of same width and same space should be left between the consecutive bars.
Now we shall draw the bar chart, as shown below:
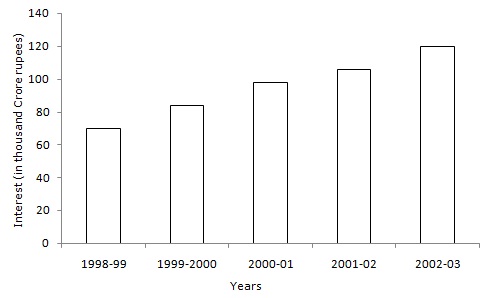
Question 8:
Take the years along the x-axis and the Interest (in Thousand Crore Rupees) along the y-axis.
Along the y-axis, take 1 big division =20 units.
All the bars should be of same width and same space should be left between the consecutive bars.
Now we shall draw the bar chart, as shown below:
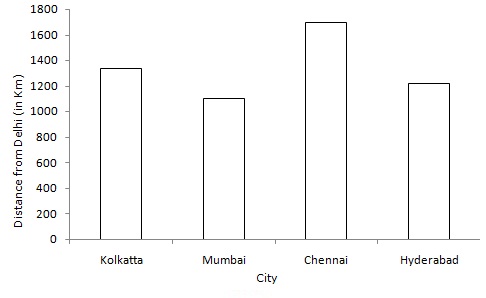
Question 9:
Take city along the x-axis and distance from Delhi (in Km) along the y-axis.
Along the y-axis, take 1 big division =200 units.
All the bars should be of same width and same space should be left between the consecutive bars.
Now we shall draw the bar chart, as shown below:
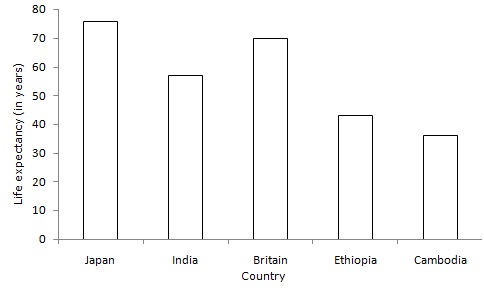
Question 10:
Take Country along the x-axis and Life expectancy (in years) along the y-axis.
Along the y-axis, take 1 big division =10 units.
All the bars should be of same width and same space should be left between the consecutive bars.
Now we shall draw the bar chart, as shown below:
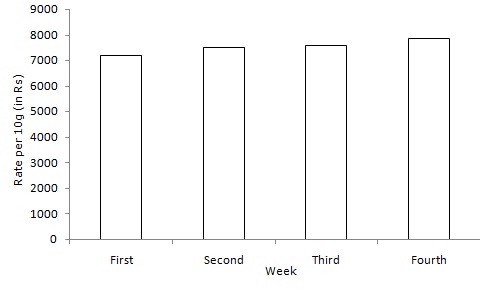
Question 11:
Take the number of week along the x-axis and rate per 10gm (in Rs.) along the y-axis.
Along the y-axis, take 1 big division =1000 units.
All the bars should be of same width and same space should be left between the consecutive bars.
Now we shall draw the bar chart, as shown below:
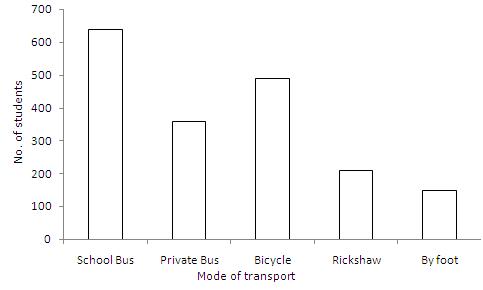
Question 12:
Take themode of transport along the x-axis and the number of students along the y-axis.
Along the y-axis, take 1 big division = 100 units.
All the bars should be of same width and same space should be left between the consecutive bars.
Now we shall draw the bar chart, as shown below:
Question 13:
(i) The bar graph shows the marks obtained by a student in various subject in an examination.
(ii) The student is very good in mathematics.
(iii) He is poor in Hindi
(iv) Average marks = \(\frac { (60+35+75+50+60) }{ 5 } =\frac { 280 }{ 5 } =56 \)
Exercise 14C
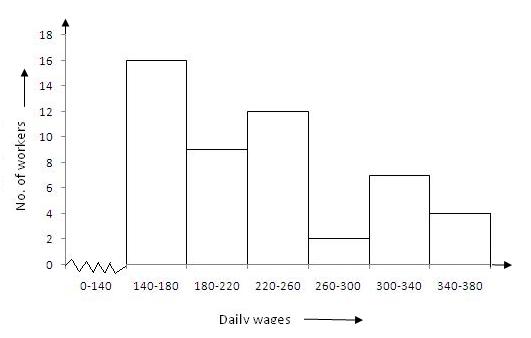
Question 1:
Given frequency distribution is as below :
| Daily wages (in Rs) | 140-180 | 180-220 | 220-260 | 260-300 | 300-340 | 340-380 |
| No. of workers | 16 | 9 | 12 | 2 | 7 | 4 |
In the class intervals, if the upper limit of one class is the lower limit of the next class, it is known as the exclusive method of classification.
Clearly, the given frequency distribution is in the exclusive form.
To draw the required histogram , take class intervals , i.e. daily wages (in Rs. ) along x-axis and frequencies i.e.no. of workers along y-axis and draw rectangles . So , we get the required histogram .
Since the scale on X-axis starts at 140, a kink(break) is indicated near the origin to show that the graph is drawn to scale beginning at 140.
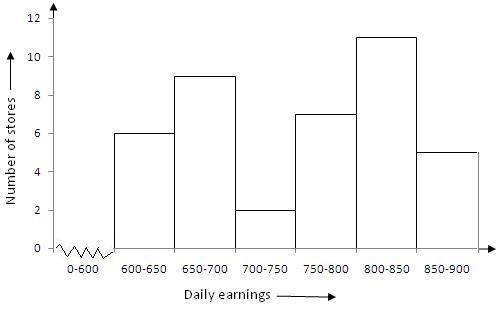
Question 2:
Given frequency distribution is as below :
Daily earnings (in Rs) | 600-650 | 650-700 | 700-750 | 750-800 | 800-850 | 850-900 |
| No of stores | 6 | 9 | 2 | 7 | 11 | 5 |
In the class intervals, if the upper limit of one class is the lower limit of the next class, it is known as the exclusive method of classification.
Clearly, the given frequency distribution is in the exclusive form.
We take class intervals, i.e. daily earnings (in Rs .) along x-axis and frequencies i.e. number of stores along y-axis. So , we get the required histogram .
Since the scale on X-axis starts at 600, a kink(break) is indicated near the origin to show that the graph is drawn to scale beginning at 600.
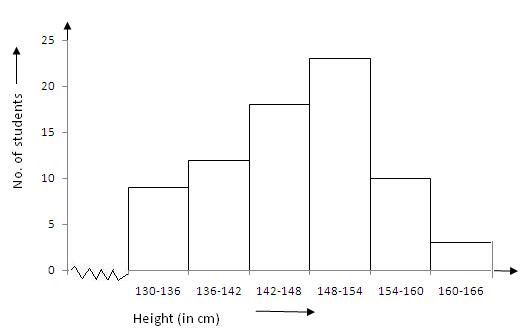
Question 3:
Give frequency distribution is as below :
Height (in cm) | 130-136 | 136-142 | 142-148 | 148-154 | 154-160 | 160-166 |
| No. of students | 9 | 12 | 18 | 23 | 10 | 3 |
In the class intervals, if the upper limit of one class is the lower limit of the next class, it is known as the exclusive method of classification.
Clearly, the given frequency distribution is in the exclusive form.
We take class intervals, i.e. height (in cm ) along x-axis and frequencies i.e. number of student s along y-axis . So we get the required histogram.
Since the scale on X-axis starts at 130, a kink(break) is indicated near the origin to show that the graph is drawn to scale beginning at 130.
Question 4:
Give frequency distribution is as below :
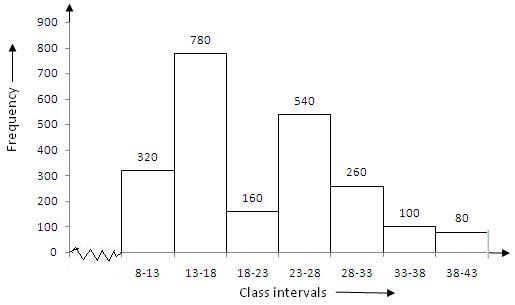
Class Interval | 8-13 | 13-18 | 18-23 | 23-28 | 28-33 | 33-38 | 38-43 |
Frequency | 320 | 780 | 160 | 540 | 260 | 100 | 80 |
In the class intervals, if the upper limit of one class is the lower limit of the next class, it is known as the exclusive method of classification.
Clearly, the given frequency distribution is in the exclusive form.
We take class intervals along x-axis and frequency along y-axis . So , we get the required histogram.
Since the scale on X-axis starts at 8, a kink(break) is indicated near the origin to show that the graph is drawn to scale beginning at 8.
Question 5:
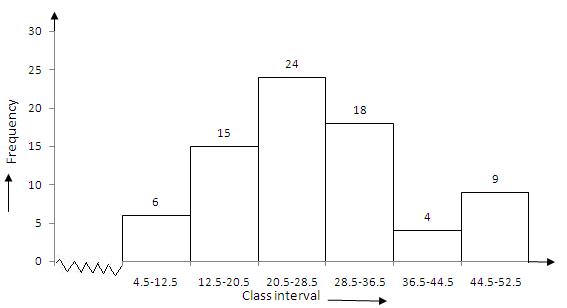
Histogram is the graphical representation of a frequency distribution in the form of rectangles, such that there is no gap between any two successive rectangles.
Clearly the given frequency distribution is in inclusive form, that is there is a gap between the upper limit of a class and the lower limit of the next class.
Therefore, we need to convert the given frequency distribution into exclusive form, as shown below:
Class Interval | 4.5-12.5 | 12.5-20.5 | 20.5-28.5 | 28.5-36.5 | 36.5-44.5 | 44.5-52.5 |
| Frequency | 6 | 15 | 24 | 18 | 4 | 9 |
To draw the required histogram , take class intervals, along x-axis and frequencies along y-axis and draw rectangles . So, we get the required histogram .
Since the scale on X-axis starts at 4.5, a kink(break) is indicated near the origin to show that the graph is drawn to scale beginning at 4.5.
Question 6:
Given frequency distribution is as below :
Age group (in years ) | 10-16 | 17-23 | 24-30 | 31-37 | 38-44 | 45-51 | 52-58 |
| No. of Illiterate persons | 175 | 325 | 100 | 150 | 250 | 400 | 525 |
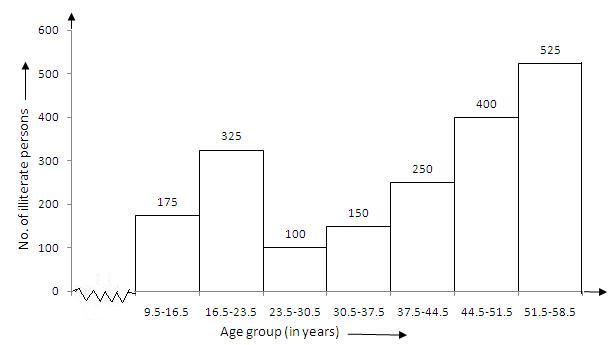
Histogram is the graphical representation of a frequency distribution in the form of rectangles, such that there is no gap between any two successive rectangles.
Clearly the given frequency distribution is in inclusive form, that is there is a gap between the upper limit of a class and the lower limit of the next class.
Therefore, we need to convert the frequency distribution in exclusive form, as shown below:
Age group(in years) | 9.5-16.5 | 16.5-23.5 | 23.5-30.5 | 30.5-37.5 | 37.5-44.4 | 44.5-51.5 | 51.5-58.5 |
No of Illiterate persons | 175 | 325 | 100 | 150 | 250 | 400 | 525 |
To draw the required histogram , take class intervals, that is age group, along x-axis and frequencies, that is number of illiterate persons along y-axis and draw rectangles . So , we get the required histogram.
Since the scale on X-axis starts at 9.5, a kink(break) is indicated near the origin to show that the graph is drawn to scale beginning at 9.5.
Question 7:
Given frequency distribution is as below :
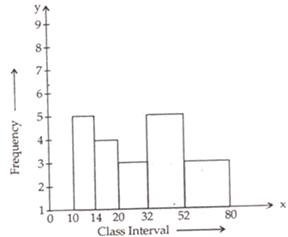
Class Interval | 10-14 | 14-20 | 20-32 | 32-52 | 52-80 |
| Frequency | 5 | 6 | 9 | 25 | 21 |
In the above table , class intervals are of unequal size, so we calculate the adjusted frequency by using the following formula :
\(Adjusted\quad Frequency=\frac { Minimum\quad class\quad size\quad \times \quad its\quad frequency }{ Class\quad size\quad of\quad this\quad class } \)
Thus , the adjusted frequency table is
| Class Intervals | Frequency | Adjusted Frequency |
| 10 – 14 | 5 | \(\frac { 4 }{ 4 } \times 5=5 \) |
| 14 – 20 | 6 | \(\frac { 4 }{ 6 } \times 6=4 \) |
| 20 – 32 | 9 | \(\frac { 4 }{ 12 } \times 9=3 \) |
| 32 – 52 | 25 | \(\frac { 4 }{ 20 } \times 25=5 \) |
| 52 – 80 | 21 | \(\frac { 4 }{ 28 } \times 21=3 \) |
Now take class intervals along x-axis and adjusted frequency along y-axis and constant rectangles having their bases as class-size and heights as the corresponding adjusted frequencies.
Thus, we obtain the histogram as shown below:
Question 8:
The given frequency distribution is as below:
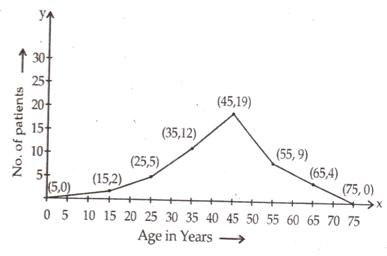
Age in years | 10-20 | 20-30 | 30-40 | 40-50 | 50-60 | 60-70 |
| No of patients | 2 | 5 | 12 | 19 | 9 | 4 |
In order to draw, frequency polygon, we require class marks.
The class mark of a class interval is: \(\frac { upper\quad limit\quad +\quad lower\quad limit }{ 2 } \)
The frequency distribution table with class marks is given below:
| Class Intervals | Class Marks | Frequency |
| 0 – 10 | 5 | 0 |
| 10 – 20 | 15 | 2 |
| 20 – 30 | 25 | 5 |
| 30 – 40 | 35 | 12 |
| 40 – 50 | 45 | 19 |
| 50 – 60 | 55 | 9 |
| 60 – 70 | 65 | 4 |
| 70 – 80 | 75 | 0 |
In the above table, we have taken imaginary class intervals 0-10 at beginning and 70-80 at the end, each with frequency zero . Now take class marks along x-axis and the corresponding frequencies along y-axis.
Plot points (5,0), (15,2), (25, 5), (35, 12), (45, 19), (55, 9), (65, 4) and (75, 0) and draw line segments.
Question 9:
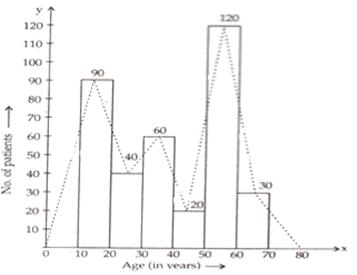
The given frequency distribution is as below
Age in years | 10-20 | 20-30 | 30-40 | 40-50 | 50-60 | 60-70 |
| Numbers of patients | 90 | 40 | 60 | 20 | 120 | 30 |
Take class intervals i.e age in years along x-axis and number of patients of width equal to the size of the class intervals and height equal to the corresponding frequencies.
Thus we get the required histogram.
In order to draw frequency polygon, we take imaginary intervals 0-10 at the beginning and 70-80 at the end each with frequency zero and join the mid-points of top of the rectangles.
Thus, we obtain a complete frequency polygon, shown below:
Question 10:
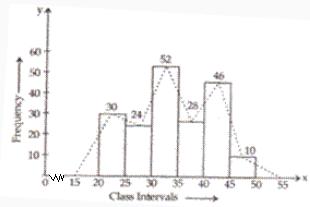
The given frequency distribution is as below :
Class Intervals | 20-25 | 25-30 | 30-35 | 35-40 | 40-45 | 45-50 |
Frequency | 30 | 24 | 52 | 28 | 46 | 10 |
Take class intervals along x-axis and frequencies along y-axis and draw rectangle s of width equal to the size of the class intervals and heights equal to the corresponding frequencies.
Thus we get required histogram.
Now take imaginary class intervals 15-20 at the beginning and 50-55 at the end , each with frequency zero and join the mid points of top of the rectangles to get the required frequency polygon.
Question 11:
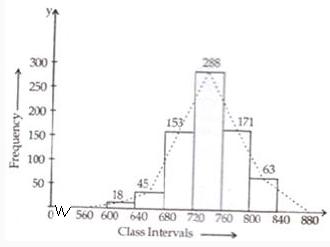
The given frequency distribution table is given below :
Class Interval | 600-640 | 640-680 | 680-720 | 720-760 | 760-800 | 800-840 |
| Frequency | 18 | 45 | 153 | 288 | 171 | 63 |
Take class intervals along x-axis and frequencies along y-axis and draw rectangles of width equal to to size of class intervals and height equal to their corresponding frequencies.
Thus we get the required histogram.
Take imaginary class intervals 560-600 at the beginning and 840-880 at the end, each with frequency zero.
Now join the mid points of the top of the rectangles to get the required frequency polygon.
Question 12:
The given frequency distribution table is as below:
Class Intervals | 1-10 | 11-20 | 21-30 | 31-40 | 41-50 | 51-60 |
| Frequency | 8 | 3 | 6 | 12 | 2 | 7 |
This table has inclusive class intervals and so these are to be converted into exclusive class intervals (i.e true class limits).
These are (0.5-10.5), (10.5-20.5), (20.5-30.5), (30.5-40.5), (40.5-50.5), and (50.5-60.5)
In order to draw a frequency polygon, we need to determine the class marks. Class marks of a class interval = \(\frac { upper\quad limit\quad +\quad lower\quad limit }{ 2 } \)
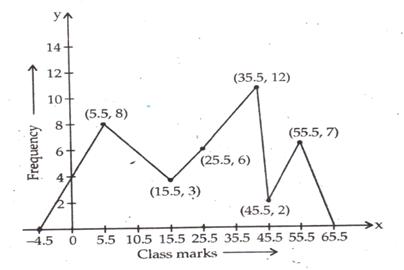
Take imaginary class interval ( -9.5-0.5) at the beginning and (60.5-70.5) at the end , each with frequency zero. So we have the following table
Class Intervals | True class Intervals | Class marks | Frequency |
| (-9)-0 1-10 11-20 21-30 31-40 41-50 51-60 61-70 | (-9.5)-0.5 0.5-10.5 10.5-20.5 20.5-30.5 30.5-40.5 40.5-50.5 50.5-60.5 60.5-70.5 | -4.5 5.5 15.5 25.5 35.5 45.5 55.5 65.5 | 0 8 3 6 12 2 7 0 |
Now, take class marks along x-axis and their corresponding frequencies along y-axis.
Mark the points and join them.
Thus, we obtain a complete frequency polygon as shown below:
Exercise 14D
Question 1:
(i) first eight natural numbers are:
1,2,3,4,5,6,7and 8

(ii) First ten odd numbers are:
1,3,5,7,9,11,13,15, 17, and 19

(iii) First five prime numbers are: 2, 3, 5, 7, 11

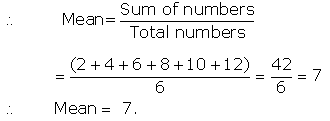
(iv) First six even numbers are: 2,4,6,8,10,12
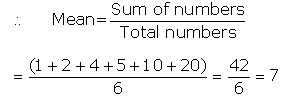
(v) First seven multiples of 5 are: 5,10,15, 20, 25, 30, 35
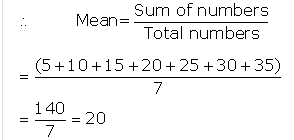
Therefore, Mean =20
(vi) Factors of 20 are: 1,2,4,5,10,20
Question 2:

Question 3:
![]()

Question 4:

Question 5:

Question 6:

Question 7:
Let the given numbers be x1,x2……..x24

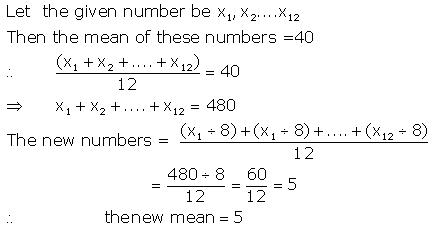
Question 8:
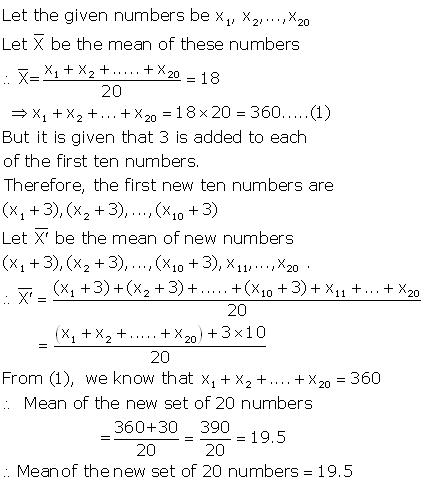
Let the given numbers be x1, x2……..x20
Then , the mean of these numbers =

Question 9:
Let the given numbers be x1, x2…………x15
Then , the mean of these numbers =

Question 10:
Question 11:
Question 12:
Mean weight of the boys =48 kg
Therefore , Mean weight = \(\frac { Sum of the weight of six boys }{ 6 }=48 \)
Sum of the weight of 6 boys =(48×6)kg =288kg
Sum of the weights of 5 boys=(51+45+49+46+44)kg=235kg
Weight of the sixth boy=(sum of the weights of 6 boys ) – (sum of the weights of 5 boys)
=(288-235)=53kg.
∴ weight of the sixth boy = 53kg
Question 13:
Calculated mean marks of 50 students =39
calculated sum of these marks=(39x 50)=1950
Corrected sum of these marks
=[1950-(wrong number)+(correct number)]
=(1950-23+43) =1970
∴ correct mean = \(\frac { 1970 }{ 50}=39.4 \)
Question 14:
calculated mean of 100 items =64
sum of 100 items, as calculated = (100×64) =6400
Correct sum of these items =[6400-(wrong items )+(correct items)]
=[6400-(26+9)+(36+90)]
=[6400-35+126]=6491
∴ Correct mean = \(\frac { 6491 }{ 100}=64.91 \)
Question 15:
Mean of 6 numbers = 23
Sum of 6 numbers =(23×6 )=138
Again , mean of 5 numbers =20
Sum of 5 numbers=(20x 5 ) =100
The excluded number= (sum of 6 numbers )-(sum of 5 numbers)
=(138-100) =38
∴ The excluded number=38.
Exercise 14E
Question 1:
Mean marks of 7 students = 226
Sum of marks of seven students =(226×7)=1582
Marks obtained by 6 students = (340+180+260+56+275+307)
=1418
∴ Marks obtained by seventh student
= [(Sum of marks of 7 students)-(marks obtained by 6 students)]
=(1582-1418)=164
∴ Marks obtained by seventh student=164
Question 2:
Mean weight of 34 students = 46.5 kg
Total weight of 34 students =(34×46.5)kg =1581 kg
Mean weight of 34 students and the teacher =(46.5+0.5)kg=47kg (since 500 g = 0.5 kg)
∴ Total weight of 34 students and the teacher
=(47×35)kg =1645kg
∴ Weight of the teacher =(1645-1581)kg= 64kg
Question 3:
Mean weight of 36 students = 41 kg
Total weight of 36 students = 41x 36 kg = 1476kg
One student leaves the class mean is decreased by 200 g.
∴ New mean =(41-0.2)kg = 40.8 kg (since 200 g = 0.2 kg)
Total weight of 35 students = 40.8×35 kg = 1428 kg.
∴ the weight of the student who left =(1476-1428)kg =48 kg.
Question 4:
Mean weight of 39 students =40 kg
Total weight of 39 students = 40x 39) = 1560 kg
One student joins the class mean is decreased by 200 g.
∴ New mean =(40-0.2)kg = 39.8 kg (since 200 g = 0.2 kg)
Total weight of 40 students =(39.8×40)kg=1592 kg.
∴ the weight of new student
= Total weight of 40 students – Total weight of 39 students
= 1592-1560 = 32 kg
Question 5:
Mean salary of 20 workers =Rs.7650
Total salary of 20 workers =Rs(7650x 20)=Rs. 153000.
Now if managers salary is added mean becomes Rs. 8200
∴ Total salary of 20 workers + manager’s salary= Rs.(8200×21)
=Rs. 172200
∴ Manager’s salary per month
= Total salary of 20 workers and the Manager – Total salary of 20 workers
=Rs(172200-153000)
=Rs.19200
Question 6:
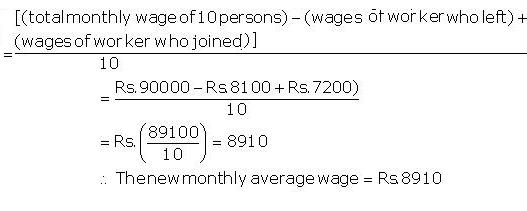
Mean monthly wage of 10 persons =Rs.9000
Total monthly wage of 10 persons=Rs(9000×10)
=Rs. 90000
New mean monthly wage
Question 7:
Mean consumption of petrol for the first 7 months=330 litres
Total consumption of petrol for the first 7 months=(330×7)liters=2310 litres
Mean consumption of petrol for the next five 5 months=270 litres
Total consumption of petrol for the next five 5 months=(270×5)=1350 litres
Total consumption of petrol in one year
=(2310+1350) litres
=3660 litres.
∴ Mean consumption of petrol = \(\frac { 3660 }{ 12 } \) = 305 litres per month
Question 8:
Mean of 15 numbers=18
Total sum of 15 numbers=(18×15)=270
Remaining numbers = 25 – 15 = 10
Mean of 10 numbers=13
Total sum of 10 numbers=(13x 10)=130
∴ Total sum of 25 numbers=(270+130)=400
∴ Mean of 25 numbers = \(\frac { 400 }{ 25 } \) = 16
Question 9:
Mean weight of 60 students = 52.75 kg
Sum of weight of 60 students = 60×52.75 kg
Mean weight of 25 students = 51
Sum of weight of 25 students = 25×51 kg
Remaining students = 60 – 25 = 35
Total weight of the remaining 35 students
= Sum of weight of 60 students – Sum of weight of 25 students
= (60×52.75 – 25×51)kg
=(3165-1275)=1890 kg
∴ Mean weight of remaining students = \(\frac { 1890 }{ 35 } \) = 54 kg
Question 10:
The increase in the average of 10 oarsmen = 1.5 kg
Total weight increased =(1.5×10) kg=15 kg
Since the man weighing 58 kg has been replaced,
Weight of the new man =(58+15)kg =73kg.
Question 11:
Mean of 8 numbers=35
∴ Total sum of 8 numbers = 35×8 = 280
Since One number is excluded, New mean = 35 – 3 = 32
∴ Total sum of 7 numbers = 32×7 = 224
the excluded number = Sum of 8 numbers – Sum of 7 numbers
= 280 – 224 = 56
Question 12:
Mean of 150 items = 60
Total Sum of 150 items = 150×60 = 9000
∴ Correct sum of items =[(sum of 150 items)-(sum of wrong items)+(sum of right items)]
= [9000 – (52 + 8) + (152 + 88)]
= [9000-(52+8)+(152+88)]
= 9180
∴ Correct mean = \(\frac { 9180 }{ 150 } \) = 61.2
Question 13:
Mean of 31 results=60
Total sum of 31 results = 31×60 = 1860
Mean of the first 16 results =16×58=928
Total sum of the first 16 results=16×58=928
Mean of the last 16 results=62
Total sum of the last 16 results=16×62=992
∴ The 16th result = 928 + 992 – 1860
= 1920 – 1860 = 60
∴ The 16th result = 60.
Question 14:
Mean of 11 numbers = 42
Total sum of 11 numbers = 42×11 = 462
Mean of the first 6 numbers = 37
Total sum of first 6 numbers = 37×6 = 222
Mean of the last 6 numbers = 46
Total sum of last 6 numbers = 6×46 = 276
∴ The 6th number= 276 + 222 – 462
= 498 – 462 = 36
∴ The 6th number = 36
Question 15:
Mean weight of 25 students = 52kg
Total weight of 25 students = 52×25 kg=1300 kg
Mean of the first 13 students = 48 kg
Total weight of the first 13 students = 48×13 kg = 624kg
Mean of the last 13 students = 55 kg
Total weight of the last 13 students = 55×13 kg = 715 kg
∴ The weight of 13th student
= Total weight of the first 13 students + Total weight of the last 13 students – Total weight of 25 students
= 624+715-1300 kg
= 39 kg.
Therefore, the weight of 13th student is 39 kg.
Question 16:
Mean score of 25 observations = 80
Total score of 25 observations = 80×25 = 2000
Mean score of 55 observations = 60
Total score of 55 observations = 60×55 =3300
Total no. of observations = 25+55 =80 observations
∴ Total score = 2000+3300 = 5300
∴ Mean score = \(\frac { 5300 }{ 80 } \) = 66.25
Question 17:
Average marks of 4 subjects = 50
Total marks of 4 subjects = 50×4 = 200
∴ 36 + 44 + 75 + x = 200
⇒ 155 + x = 200
⇒ x = 200 – 155 = 45
∴ The value of x = 45
Question 18:
Mean monthly salary of 75 workers = Rs. 5680
So, Total monthly salary of 75 workers = Rs. 5680×75 = Rs. 426000
Mean monthly salary of 25 workers = Rs. 5400
So, Total monthly salary of 25 workers = Rs. 5400×25 = Rs. 135000
Mean monthly salary of 30 workers = Rs. 5700
So, Total monthly salary of 30 workers = Rs. 5700×30 = Rs. 171000
Remaining workers = 75 – 55 = 20 workers
Total salary of remaining 20 workers
=Rs. [426000 – (135000 + 171000)]
= Rs. [426000 – 306000]
=Rs. 120000
∴ Mean salary of the remaining 20 workers= Rs. \(\frac { 120000 }{ 20 } \) = Rs. 6000
Question 19:
Let the distance of mark from the staring point be x km.
Then , time taken by the ship reaching the marks= \((\frac { x }{ 15 }) \) hours (since time = \(\frac { distance }{ speed } \)
Time taken by the ship reaching the starting point from the marks = \((\frac { x }{ 10 }) \) hours
Total time taken = \(\frac { x }{ 15 } \) + \(\frac { x }{ 10 } \) = \(\frac { x }{ 6 } \) hours
Total distance covered =x+x=2x km.
∴ average speed of whole journey = 2x ÷ \(\frac { x }{ 6 } \) = \(\frac { 2x\times 6 }{ x } \) = 12 km/hour
Question 20:
Total number of students = 50
Total number of girls = 50-40 = 10
Average weight of the class = 44 kg
Total weight of 50 students= 44x 50 kg = 2200kg
Average weight of 10 girls = 40 kg
Total weight of 10 girls = 40×10 kg = 400 kg
∴ Total weight of 40 boys = 2200-400 kg =1800 kg
∴ the average weight of the boys = \(\frac { 1800 }{ 40 } \) = 45 kg
Exercise 14F
Question 1:
For calculating the mean , we prepare the following table :
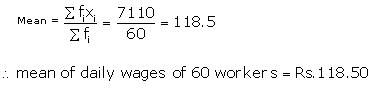
Daily wages (in Rs ) (Xi) | No of workers (fi) | fixi |
90 110 120 130 150 | 12 14 13 11 10 | 1080 1540 1560 1430 1500 |
| \(\sum { { f }_{ i } } =60 \) | 7110 |
Question 2:
For calculating the mean , we prepare the following frequency table :
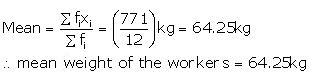
Weight (in kg) (Xi) | No of workers (fi) | fiXi |
60 63 66 69 72 | 4 3 2 2 1 | 240 189 132 138 72 |
| \(\sum { { f }_{ i } } =12 \) | 771 |
Question 3:
For calculating the mean , we prepare the following frequency table :
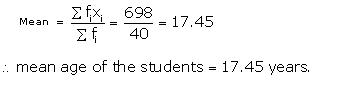
Age (in years) (Xi) | Frequency (fi) | fiXi |
15 16 17 18 19 20 | 3 8 9 11 6 3 | 45 128 153 198 114 60 |
| \(\sum { { f }_{ i } } =40 \) | 698 |
Question 4:
For calculating the mean , we prepare the following frequency table :
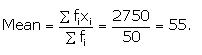
Variable (Xi) | Frequency (fi) | fiXi |
| 10 30 50 70 89 | 7 8 10 15 10 | 70 240 500 1050 890 |
| \(\sum { { f }_{ i } } =50 \) | \(\sum { { f }_{ i } } { x }_{ i }=2750 \) |
Question 5:
We prepare the following frequency table :
(Xi) | (fi) | fiXi |
| 3 5 7 9 11 13 | 6 8 15 P 8 4 | 18 40 105 9P 88 52 |
| \(\sum { { f }_{ i } } =41+p \) | \(\sum { { f }_{ i } } { x }_{ i }=303+9p \) |

⇒ 303 + 9p = 8(41+p)
⇒ 303 + 9p= 328 + 8p
⇒ 9p – 8p = 328 -303
⇒ P=25
∴ the value of P=25
Question 6:
We prepare the following frequency distribution table:
(Xi) | (fi) | fiXi |
| 15 20 25 30 35 40 | 8 7 P 14 15 6 | 120 140 25p 420 525 240 |
| \(\sum { { f }_{ i } } =50+p \) | \(\sum { { f }_{ i } } { x }_{ i }=1445+25p \) |

⇒ 1445 + 25p = (28.25)(50+p)
⇒ 1445 + 25p = 1412.50 + 28.25p
⇒ -28.25p + 25p = -1445 + 1412.50
⇒ -3.25p = -32.5
⇒ \(\frac { 32.5 }{ 3.25 } \) = 10
∴ the value of p=10
Question 7:
We prepare the following frequency distribution table:
(Xi) | (fi) | fiXi |
| 8 12 15 P 20 25 30 | 12 16 20 24 16 8 4 | 96 192 300 24p 320 200 120 |
| \(\sum { { f }_{ i } } =100 \) | \(\sum { { f }_{ i } } { x }_{ i }=1228+24p \) |

⇒ 1228 + 24p = 1660
⇒ 24p = 1660-1228
⇒ 24p = 432
⇒ \(\frac { 432 }{ 24 } \) = 18
∴ the value of p =18
Question 8:
Let f1 and f2 be the missing frequencies.
We prepare the following frequency distribution table.
(Xi) | (fi) | fixi |
10 30 50 70 90 | 17 f1 32 f2 19 | 170 30f1 1600 70f2 1710 |
| Total | 120 | 3480 + 30f1 + 70f2 |
Here,

Thus, f2 = 52 – f1…….(1)
Also,

Substituting the value of f1 in equation 1, we have,
f2=52 – 28 = 24
Thus, the missing frequencies are f1 =28 and f2=24 respectively.
Question 9:
Let the assumed mean (A) =900
Weekly wages (Xi) | No of workers (fi) | di=(xi-A) =xi-900 | fi x di |
800 820 860 900 920 980 1000 | 7 14 19 25 20 10 5 | -100 -80 -40 0 20 80 100 | -700 -1120 -760 0 400 800 500 |
| \(\sum { { f }_{ i } } =100 \) | -880 |
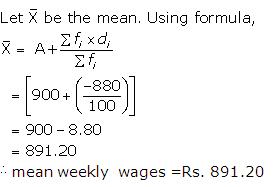
Question 10:
Let the assumed mean be A = 67
Height in cm (Xi) | No of plants (fi) | di=(xi-A) =(xi-67) | fi di |
| 61 64 67 70 73 | 5 18 42 27 8 | -6 -3 0 3 6 | -30 -54 0 81` 48 |
100 | \(\sum { { f }_{ i } } { d }_{ i }=45 \) |

Question 11:
Clearly, h=1. Let the assumed mean A=21
(Xi) | (fi) | \({ u }_{ i }=\frac { { x }_{ i }-21 }{ 1 } \) | fiui |
| 18 19 20 21 22 23 24 | 170 320 530 700 230 140 110 | -3 -2 -1 0 1 2 3 | -510 -640 -530 0 230 280 330 |
Total | \(\sum { { f }_{ i } } =2200 \) | \(\sum { { f }_{ i } } { u }_{ i }=-840 \) |

Question 12:
Clearly, h= (x2- x1)
=(600-200)=400
Let assumed mean A =1000
Height (in m) (Xi) | No of villages (fi) | \({ u }_{ i }=\frac { { x }_{ i }-1000 }{ 400 } \) | fixui |
| 200 600 1000 1400 1800 2200 | 142 265 560 271 89 16 | -2 -1 0 1 2 3 | -284 -265 0 271 178 48 |
Total | \(\sum { { f }_{ i } } =1343 \) | \(\sum { { f }_{ i } } { u }_{ i }=-52 \) |

Exercise 14G
Question 1:
(i) Arranging the data in accending order, we have
2,2,3, 5, 7, 9, 9, 10, 11
Here n = 9, which is odd
(ii) Arranging the data in ascending order , we have
6, 8, 9, 15, 16, 18, 21, 22, 25
Here n = 9, which is odd
(iii) Arranging data in ascending order:
6, 8, 9, 13, 15, 16, 18, 20, 21, 22, 25
Here n = 11 odd
(iv) Arranging the data in ascending order , we have
0, 1, 2, 2, 3, 4, 4, 5, 5, 7, 8, 9, 10
Here n = 13, which is odd
Question 2:
(i) Arranging the data in ascending order , we have
9, 10, 17, 19, 21, 22, 32, 35
Here n = 8, which is even
(ii) Arranging the data in ascending order , we have
29, 35, 51, 55, 60, 63, 72, 82, 85, 91
Here n = 10, which is even
(iii) Arranging the data in ascending order , we have
3, 4, 9, 10, 12, 15, 17, 27, 47, 48, 75, 81 Here n = 12, which is even
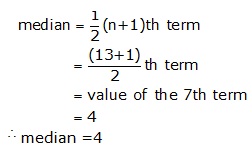
Question 3:
Arranging the data in ascending order , we have
17, 17, 19, 19, 20, 21, 22, 23, 24, 25, 26, 29, 31, 35, 40
Here n = 15, which is odd
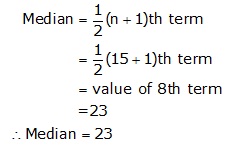
Thus, the median score is 23.
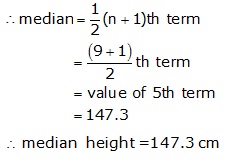
Question 4:
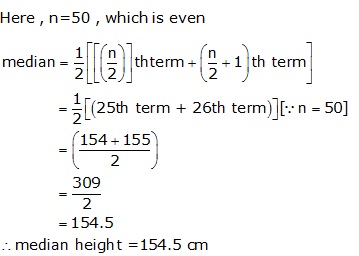
Arranging the heights of 9 girls in ascending order , we have
143.7, 144.2, 145, 146.5, 147.3, 148.5, 149.6, 150, 152.1
Here n = 9, which is odd
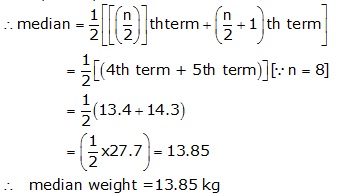
Question 5:
Arranging the weights of 8 children in ascending order, we have
9.8, 10.6, 12.7, 13.4, 14.3, 15, 16.5, 17.2
Here , n= 8 , which is even
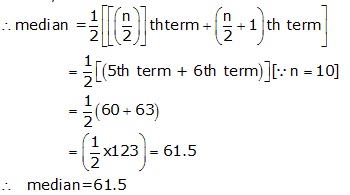
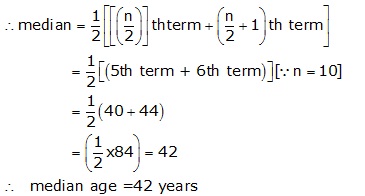
Question 6:
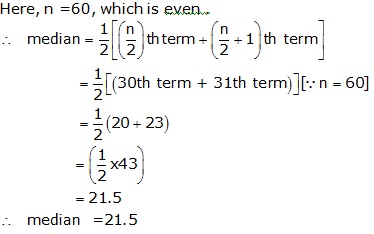
Arranging the ages of teachers in ascending order , we have
32, 34, 36, 37, 40, 44, 47, 50, 53, 54
Here, n =10, which is even
Question 7:
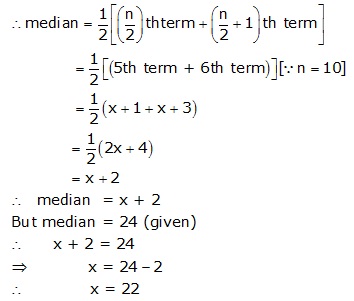
The ten observations in ascending order:
10, 13, 15, 18, x+1, x+3, 30, 32, 35, 41
Here, n =10, which is even
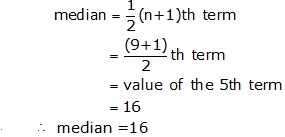
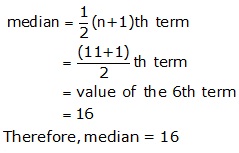
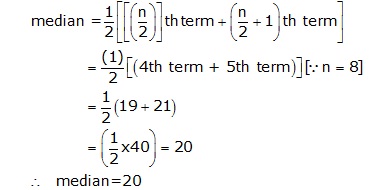
Question 8:
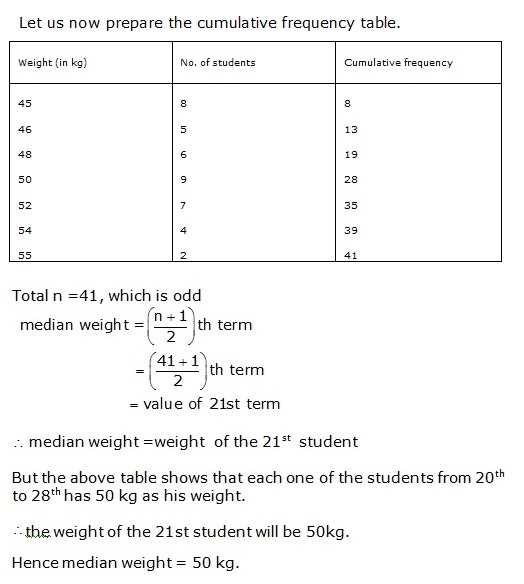
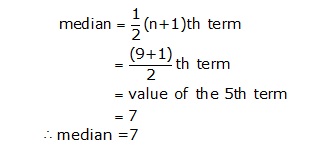
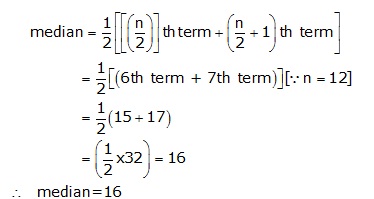
Question 9:
Arrange the terms in an ascending order, we have
Variate | 15 | 17 | 20 | 22 | 25 | 30 |
| Frequency | 3 | 5 | 9 | 4 | 6 | 10 |
Now preparing the cumulative frequency , we have
Variate | Frequency | Cumulative Frequency |
| 15 17 20 22 25 30 | 3 5 9 4 6 10 | 3 8 17 21 27 37 |
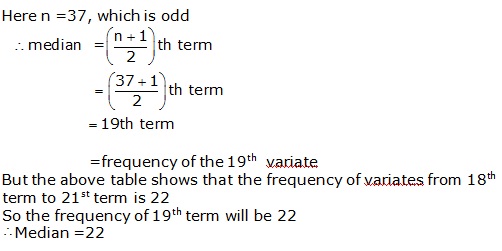
Question 10:
Arrange the terms in an ascending order, we have
Marks | 9 | 20 | 25 | 40 | 50 | 80 |
| No. of students | 4 | 6 | 16 | 8 | 7 | 2 |
Now preparing the cumulative frequency , we have
Marks | No of students(Frequency) | Cumulative Frequency |
| 9 20 25 40 50 80 | 4 6 16 8 7 2 | 4 10 26 34 41 43 |
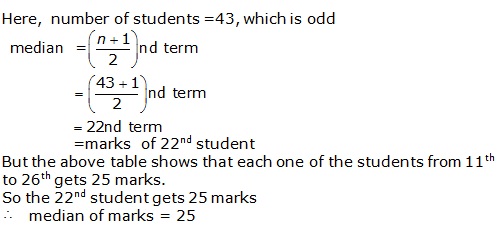
Question 11:
Arranging the terms in an ascending order, we have
Height(in cm) | 151 | 152 | 153 | 154 | 155 | 156 | 157 |
| No. of students | 6 | 3 | 12 | 4 | 10 | 8 | 7 |
Now preparing the cumulative frequency , we have
Height (in cm) | No of students Frequency | Cumulative Frequency |
| 151 152 153 154 155 156 157 | 6 3 12 4 10 8 7 | 6 9 21 25 35 43 50 |
Question 12:
Arrange the terms in an ascending order, we have
Variate | 16 | 18 | 20 | 23 | 25 | 26 | 28 | 30 |
Frequency | 9 | 8 | 13 | 4 | 4 | 6 | 11 | 5 |
Now preparing the cumulative frequency , we have
Variate | Frequency | Cumulative Frequency |
| 16 18 20 23 25 26 28 30 | 9 8 13 4 4 6 11 5 | 9 17 30 34 38 44 55 60 |
Exercise 14H
Question 1:
Arrange the given data in ascending order we have
0, 0, 1, 2, 3, 4, 5, 5, 6, 6, 6, 6
Let us prepare the following table:
Observations(x) | 0 | 1 | 2 | 3 | 4 | 5 | 6 |
| Frequency | 2 | 1 | 1 | 1 | 1 | 2 | 4 |
As 6 ocurs the maximum number of times i.e. 4, mode = 6
Question 2:
Arranging the given data in ascending order , we have:
15, 20, 22, 23, 25, 25, 25, 27, 40
The frequency table of the data is :
Observations(x) | 15 | 20 | 22 | 23 | 25 | 27 | 40 |
| Frequency | 1 | 1 | 1 | 1 | 3 | 1 | 1 |
As 25 ocurs the maximum number of times i.e. 3, mode = 25
Question 3:
Arranging the given data in ascending order , we have:
1, 1, 2, 3, 3, 4, 5, 5, 6, 6, 7, 8, 9, 9, 9, 9, 9,
The frequency table of the data is :
Observations(x) | 1 | 2 | 3 | 4 | 5 | 6 | 7 | 8 | 9 |
Frequency | 2 | 1 | 2 | 1 | 2 | 2 | 1 | 1 | 5 |
As 9, occurs the maximum number of times i.e. 5, mode = 9
Question 4:
Arranging the given data in ascending order , we have:
9, 19, 27, 28, 30, 32, 35, 50, 50, 50, 50, 60
The frequency table of the data is :
Observations(x) | 9 | 19 | 27 | 28 | 30 | 32 | 35 | 50 | 60 |
| Frequency | 1 | 1 | 1 | 1 | 1 | 1 | 1 | 4 | 1 |
As 50, ocurs the maximum number of times i.e. 4, mode = 50
Thus, the modal score of the cricket player is 50.
Question 5:
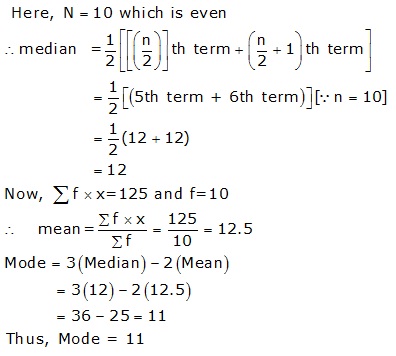
Arranging the given data in ascending order , we have:
10, 10, 11, 11, 12, 12, 13, 14, 15, 17
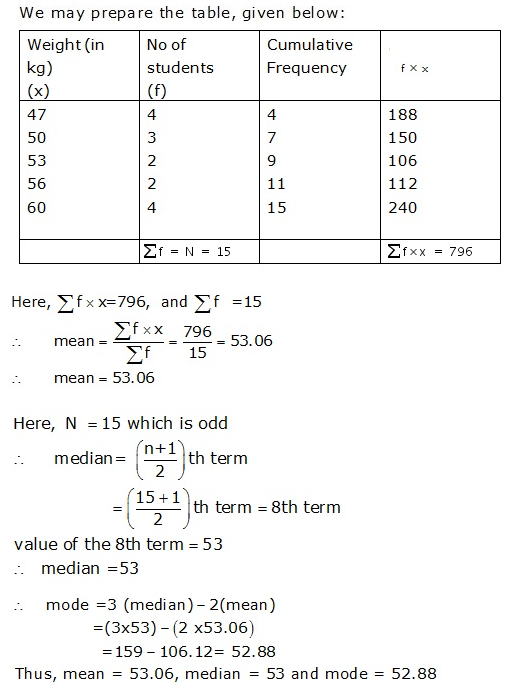
We may prepare the table, given below:
Item(x) | Frequency(f) | Cumulative Frequency | f x |
| 10 11 12 13 14 15 17 | 2 2 2 1 1 1 1 | 2 4 6 7 8 9 10 | 20 22 24 13 14 15 17 |
N=10 | \(\sum { f\times x } =125 \) |
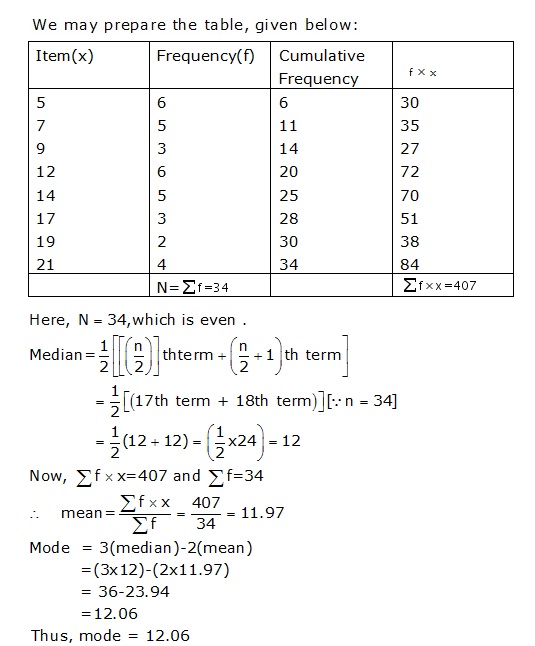
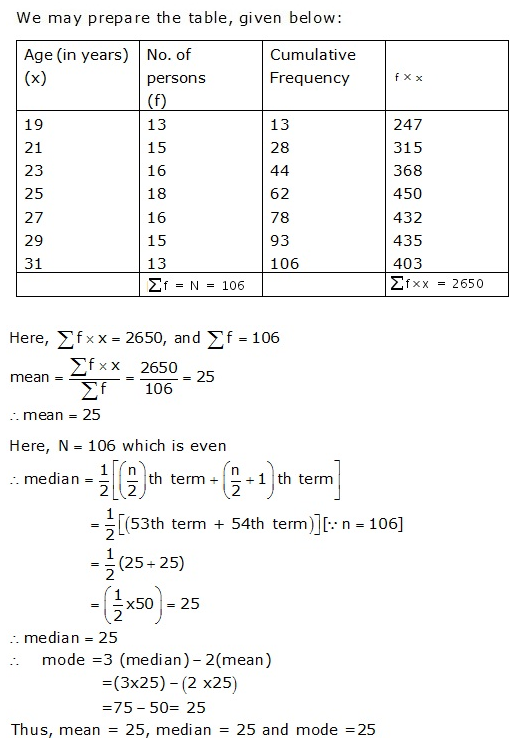
Question 6:
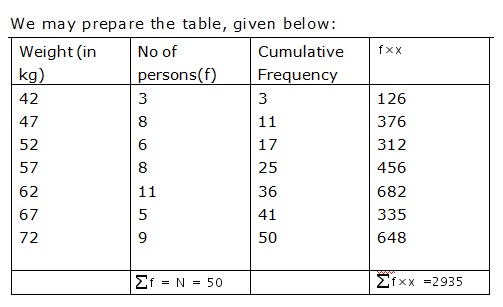
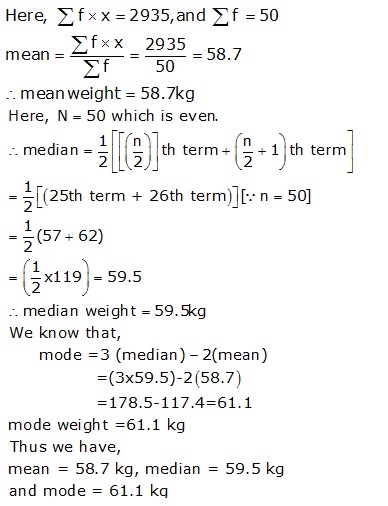
Question 7:
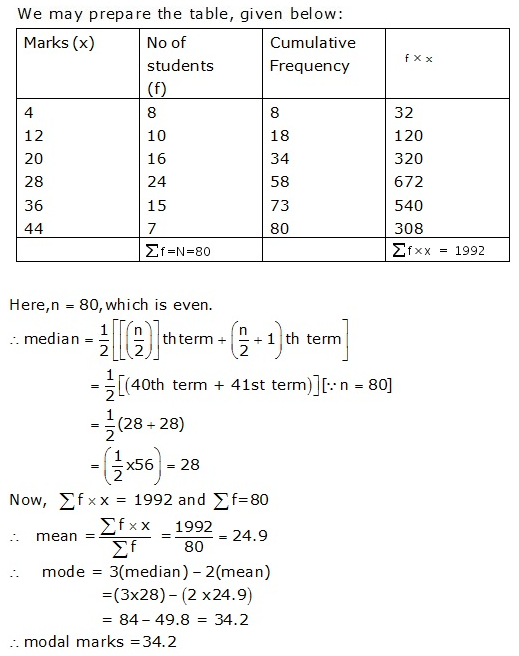
Question 8:

Question 9:
Question 10:
Question 11:
Question 12: