RS Aggarwal Solutions Class 10 Chapter 9 Mean, Median, Mode of Grouped Data Ex 9E
These Solutions are part of RS Aggarwal Solutions Class 10. Here we have given RS Aggarwal Solutions Class 10 Chapter 9 Mean, Median, Mode of Grouped Data Ex 9E
Other Exercises
- RS Aggarwal Solutions Class 10 Chapter 9 Mean, Median, Mode of Grouped Data Ex 9A
- RS Aggarwal Solutions Class 10 Chapter 9 Mean, Median, Mode of Grouped Data Ex 9B
- RS Aggarwal Solutions Class 10 Chapter 9 Mean, Median, Mode of Grouped Data Ex 9C & 9D
- RS Aggarwal Solutions Class 10 Chapter 9 Mean, Median, Mode of Grouped Data Ex 9E
- Mean, Median, Mode of Grouped Dat
Exercise 9E
Question 1:
From the given table, we may prepare the cumulative frequency table as shown below:
| Class interval | C.F |
| Less than 220 | 7 |
| Less than 240 | 10 |
| Less than260 | 16 |
| Less than 280 | 24 |
| Less than 300 | 26 |
| Less than 320 | 30 |
On a graph paper, we plot the point (220, 7), (240, 10), (260, 16), (280, 24), (300, 26), (320, 30)
We join these points successively with a freehand to get the cumulative frequency curve or an ogive
Here N = 30, \(\frac { N }{ 2 } \)= 15
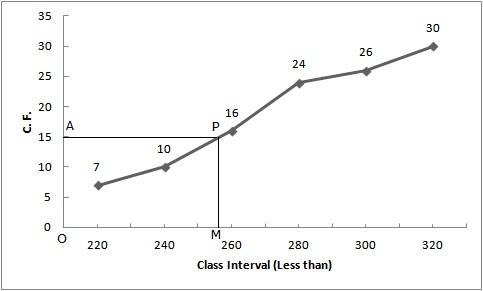
Take point (0, 15) on the y-axis and draw AP || x-axis meeting the curve at P. Draw PM ⊥ x -axis intersecting the x-axis at M. Then OM = 258 and hence median = 258.
Read More:
Question 2:
Cumulative frequency table is as follows:
| Marks | C.F |
| Marks less than 10 | 3 |
| Marks less than 20 | 11 |
| Marks less than 30 | 28 |
| Marks less than 40 | 48 |
| Marks less than 50 | 70 |
Scale :
Horizontal: 1 small div = 10 marks
Vertical : 1 small div = 10 students
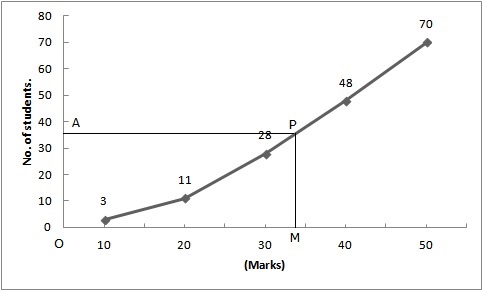
The points (10, 3), (20, 11), (30, 28), (40, 48), (50, 70) are plotted and joined as shown above. This is required cumulative curve.
N = 70, \(\frac { N }{ 2 } \)= 35
Ob vertical line OY, take OA = 35
Through A, a horizontal line AP is drawn meeting the graph at P
Through P, a vertical line PM is drawn.
Now, OM = 34, therefore Median = 34
More Resources
Question 3:
The following table gives height in metre of 360 tress:
Height in m | Number of trees |
| Less than 7 Less than 14 Less than 21 Less than 28 Less than 35 Less than 42 Less than 49 Less than 56 | 25 45 95 140 235 275 320 360 |
The points (7, 25), (14, 45), 21, 95), (28, 140), (35, 235), (42, 275), (49, 320), (56, 360) are plotted and joined one by one as shown in the figure.
This is the required cumulative curve
N = 360, \(\frac { N }{ 2 } \)= 180
At y = 180, affix A.
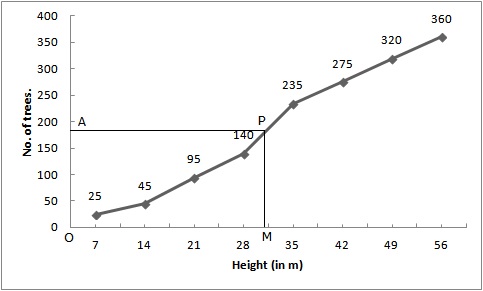
Through A, draw a horizontal line meeting the curve at P.
Through P, a vertical line is drawn which meets OX at M.
OM = 31.
Hence median = 31
Question 4:
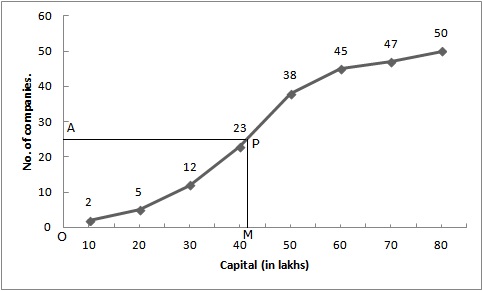
Less than series
Less than Capital (in lakh of Rs) | No. of Companies (C.F.) |
| Less than 10 Less than 20 Less than 30 Less than 40 Less than 50 Less than 60 Less than 70 Less than 80 | 2 5 12 23 38 45 47 50 |
Scale: Horizontal : 1 small div = capital of 1 lakh of Rs
Vertical: 1 small div. = 1 company.
Plot the points (10, 2), (20, 5), (30, 12), (40, 23), (50, 38), (60, 45), (70, 47) and (80, 50).
Through A(0, 25), AP is drawn parallel to OX and PM OX, OM = 41. Hence median = 41.
Question 5:
More than series
| Score | No of Candidates |
| More than 400 | 230 |
| More than 450 | 210 |
| More than 500 | 175 |
| More than 550 | 135 |
| More than 600 | 103 |
| More than 600 | 79 |
| More than 700 | 52 |
| More than 750 | 34 |
We plot the points (400, 230), (450, 210), (500, 175), (550, 135), (600, 103), (650, 79), (700, 52), (750, 34)
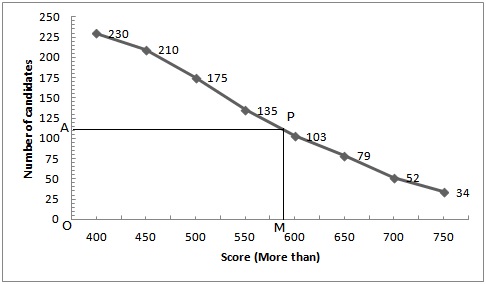
Hence, N = 230, \(\frac { N }{ 2 } \)= 115
Take a point A(0, 115) on the y-axis and draw AP||x-axis meeting the curve at P, Draw PM x-axis intersecting x-axis at M
Then, OM = 590
Hence median = 590
Question 6:
(i) Less than series:
Marks | Number of Students |
| Less than 5 Less than 10 Less than 15 Less than 20 Less than 25 Less than 30 Less than 35 Less than 40 Less than 45 Less than 50 | 2 7 13 21 31 56 76 94 98 100 |
Plot the points (5, 2), (10, 7), (15, 13), (20, 21), (25, 31), (30, 56), (35, 76), (40, 94), (45, 98) and (50, 100)
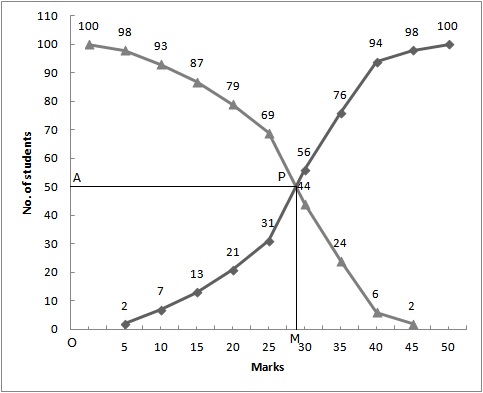
Join these points free hand to get the curve representing “less than” cumulative curve.
(ii) From the given table we may prepare the ‘more than’ series as shown below
Marks | Number of Students |
| More than 45 More than 40 More than 35 More than 30 More than 25 More than 20 More than 15 More than 10 More than 5 More than 0 | 2 6 24 44 69 79 87 93 98 100 |
Now, on the same graph paper as above, we plot the point (0, 100), (5, 98), (10, 93), (15, 87), (20, 79), (25, 69), (30, 44), (35, 24) and (40, 6) and (45, 2)Plot the points (5, 2), (10, 7), (15, 13), (20, 21), (25, 31), (30, 56), (35, 76), (40, 94), (45, 98) and (50, 100)
Join these points free hand to get required curve
Here N = 100, \(\frac { N }{ 2 } \)= 50
Two curves intersect at point P(28, 50)
Hence, the median = 28
Question 7:
We may prepare less than series and more than series
(i) Less than series
Height in (cm) | Frequency |
| Less than 140 Less than 144 Less than 148 Less than 152 Less than 156 Less than 160 Less than 164 Less than 168 Less than 172 Less than 176 Less than 180 | 0 3 12 36 67 109 173 248 330 416 450 |
Now on graph paper plot the points (140, 0), (144, 3), (148, 12), (152, 36), (156, 67), (160, 109), (164, 173), (168, 248), (172, 330), (176, 416), (180, 450)
(ii) More than series
Height in (cm) | C.F. |
| More than 140 More than 144 More than 148 More than 152 More than 156 More than 160 More than 164 More than 168 More than 172 More than 176 More than 180 | 450 447 438 414 383 341 277 202 120 34 0 |
Now on the same graph plot the points (140, 450), (144, 447), (148, 438), (152, 414), (156, 383), (160, 341), (164, 277), (168, 202), (172, 120), (176, 34), (180, 0)
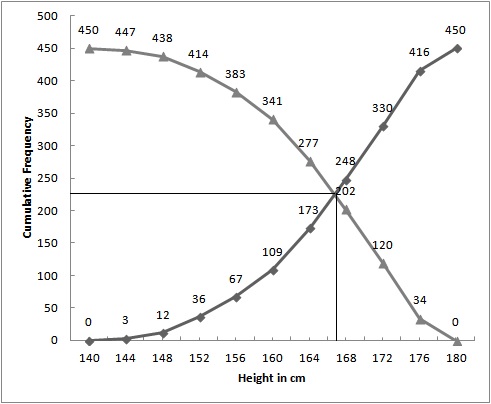
The curves intersect at (167, 225).
Hence, 167 is the median.
Hope given RS Aggarwal Solutions Class 10 Chapter 9 Mean, Median, Mode of Grouped Data Ex 9E are helpful to complete your math homework.
If you have any doubts, please comment below. A Plus Topper try to provide online math tutoring for you.