Regression Analysis
DEFINITION:
Statistical Regression
-the relation between selected values of x and observed values of y, from which the most probable value of y can be predicted for any value of x.
The term “regression” is attributed to Sir Francis Galton (nineteenth century) as he described data as “regressing” toward the mean when studying relationships between parents and children. It is suggested that R. J. Adcock (of the same era) may have actually been the first to utilize linear regression. [Source: David Finney, Journal of Applied Statistics]
In Algebra, we studied “line of best fit” with statistical data. At that time we saw how to prepare a linear regression on the graphing calculator.
(follow the link to refresh your memory on line of best fit and linear regression)
Not all data, however, lends itself to being represented by a straight line. These non-linear regressions are also found using the graphing calculator. All types of regressions on the calculator are prepared in a similar manner.
The goal of determining a regression is to obtain an equation from which we can predict one variable based upon another variable.
The Correlation Coefficient is an indication of how well a model fits a particular set of data.
The correlation coefficient is designated by r and falls into the range -1 < r < 1. If r is close to 1 (or -1), the model is considered a “good fit”. If r is close to 0, the model is “not a good fit”. Comparing correlation coefficients of different regression models for the same set of data cannot be used to determine which is the best regression model.
Let’s see how this process unfolds in this example:
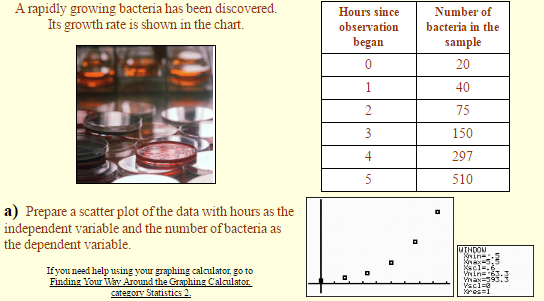
b) Determine which regression model will best approximate your data.
We will limit our choices to linear, logarithmic, exponential, and power as possible regression models. The scatter plot of the data clearly shows a “curve” to the data, so we will eliminate the linear model at this time. The positioning of the plots appears to be compatible with an exponential model, or possibly a power model since the plots might be the right hand side of a parabola. Let’s examine both.
The exponential model is a “good fit”, as it passes through most of the plotted points and appears to follow the increasing rate of the data.
The power model hits only a few of the points and does not seem to follow the degree of increase as well as the exponential model.
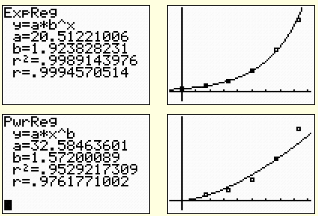
(NOTE: Power regressions on the calculator will not allow the independent variable to be zero. For that reason, the zero time and corresponding number of bacteria had to be eliminated from the data set for this plot.)
Choose the exponential model. It makes sense that this model would best represent the data, since exponential models are often used with population growth (even when the population is bacteria).
c) Write the regression equation for your model, rounding values to three decimal places.

d) What is the correlation coefficient for this data and what does it tell you?
The correlation coefficient is r = .9994570514.
The closer this value is to 1, the more accurate your model will be when used for predictions. This model will be a good predictor.
Notice that both the exponential and the power regression models showed high correlation coefficients, but examination of the graph showed that the exponential model was the better fit.
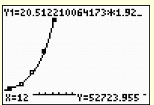
e) Using your regression equation, determine how many bacteria, to the nearest integer, will be present in 12 hours.
Substituting 12 into the equation, we arrive at an answer of 52,724 bacteria, to the nearest integer. Looking for values that fall outside the plotted data is called extrapolating. Be careful when extrapolating. The further away from the plotted data you go, the less reliable is your prediction.
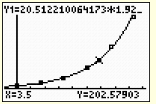
f) Using your regression equation, determine how many bacteria, to the nearest integer, will be present in 3.5 hours.
Substituting 3.5 into the equation, we arrive at an answer of 203 bacteria, to the nearest integer. Looking for values that fall within the plotted data is called interpolating.