ML Aggarwal Class 6 Solutions for ICSE Maths Chapter 15 Data Handling Ex 15.3
Question 1.
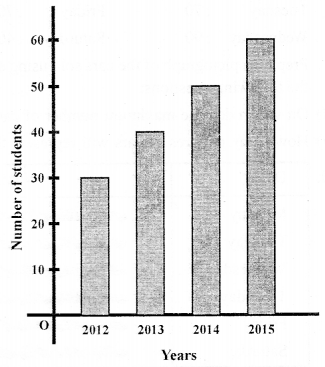
Observe the adjoining bar graph showing the number of students in a particular class of a school.
Answer the following questions:
(i) What is the scale of this graph?
(ii) How many new students are added every year?
(iii) Is the number of students in the year 2015 is twice than that of in the year 2012?
Solution:
(i) 1 unit height = 10 students
(ii) 10
(iii) Yes
Question 2.
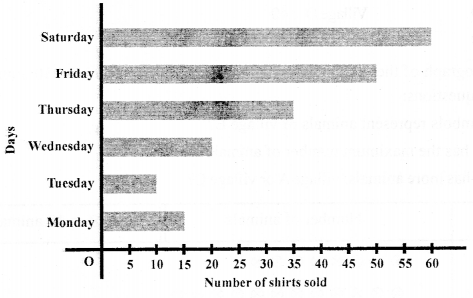
Observe the bar graph given below which is showing the sale of shirts in a readymade garment shop from Monday to Saturday.
Answer the following questions:
(i) What information does the above bar graph give?
(ii) What is the scale chosen on the horizontal line representing number of shirts?
(iii) On which day were the maximum number of shirts sold? How many shirts were sold on that day?
(iv) n which day were the minimum number of shirts sold?
(v) How many shirts were sold on Thursday?
Solution:
(i) The bar graph shows the number of shirts
sold from Monday to Saturday,
(iii) 1 unit length = 5 shirts
(iii) Saturday; 60
(iv) Tuesday
(v) 35
Question 3.
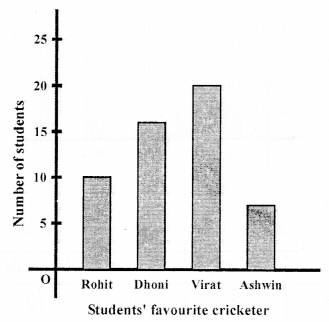
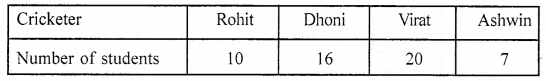
Make a table corresponding to the following graph:
Solution:
Table showing student’s favourite cricketer:
Question 4.
The following table shows the number of bicycles manufactured in a factory during the years 2011 to 2015. Illustrate this data by using a bar graph. Choose a scale of your choice.
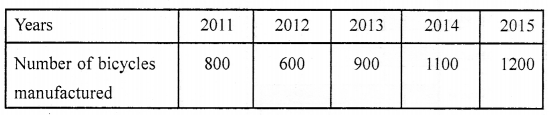
(i) In which year were the maximum number of bicycles manufactured?
(iii) In which year were the minimum number of bicycles manufactured?
Solution:
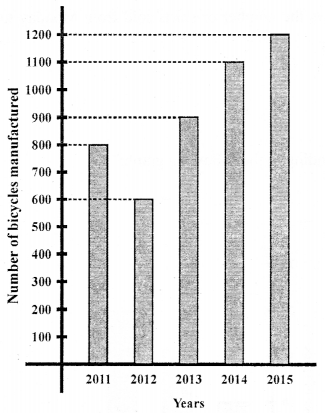
(i) 2015
(ii) 2012
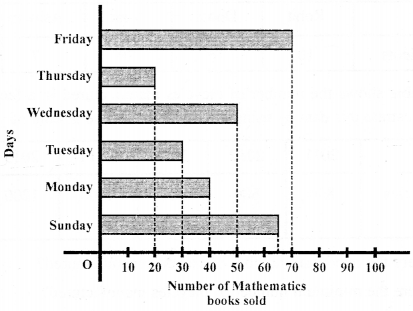
Question 5.
The number of Mathematics books sold by a shopkeeper on six consecutive days is given below:
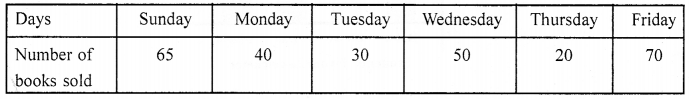
Draw a horizontal bar graph to represent the above information choosing the scale of your choice.
Solution:
Question 6.
The number of persons in various age (in years) groups in a town is given in the following table:
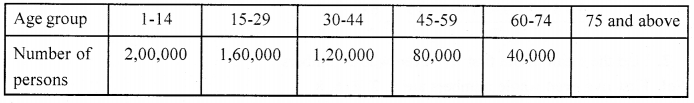
Draw a bar graph to represent the above information and answer the following questions (take 1 unit height = 20,000 people):
(i) Which age groups have same population?
(ii) All persons in the age group of 60 and above are called senior citizens. How many senior citizens are there in the town?
Solution:
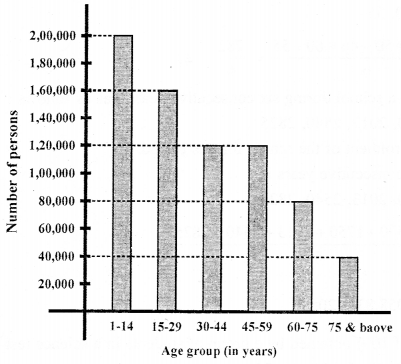
(i) 30 – 44 and 45 – 59
(ii) 1,20,000