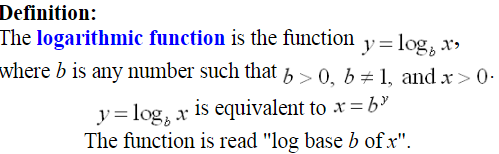
Logarithmic Functions
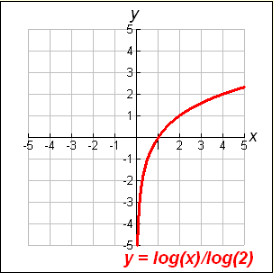
Most logarithmic graphs resemble this same shape.
This graph is very, very close to the y-axis but does not cross it. The graph increases as it progresses to the right (as seen in the graph at the right).
In a straight line, the “rate of change” remains the same across the graph. In these graphs, the “rate of change” increases or decreases across the graphs.
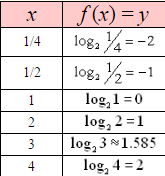
Characteristics: