Graphs of Functions y = sin(x) and y = cos(x)
Graphs of trigonometric functions can be produced in degrees or in radians.
The graphs appearing here will be done in radians.
Hint: When hand-drawing the graphs of sine and cosine, draw vertical dotted lines at π/2 intervals to remind you of the connection to the quadrants from the unit circle and to keep your graphs accurate. (Such dotted lines will resemble the dashed vertical grid lines in the graphs below.)
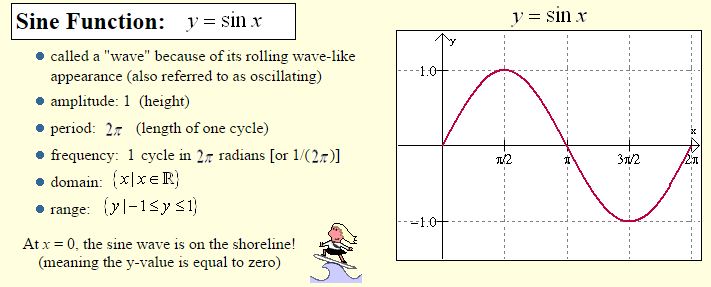
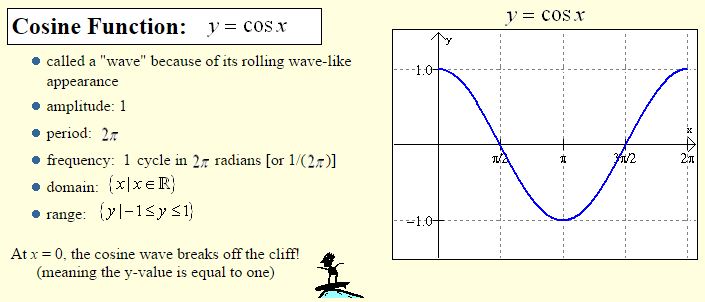
The sine and cosine functions take on y-values between -1 and 1.