Examining Graphs of Polynomial Equations of Higher Degree
Graphing polynomial functions of higher degree can be quite tedious if done by hand. Fortunately, the graphing calculator can be very helpful in providing us with graphs of these functions very quickly.
Examples:
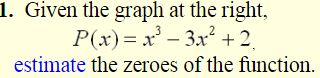
(Remember, the zeroes are the locations where the graph crosses the x-axis.)
This graph crosses the x-axis between -1 and 0, at 1, and between 2 and 3.
By observation, one estimated answer may be:
-0.75, 1, and 2.75
“
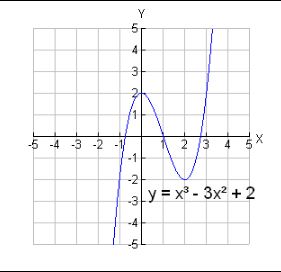
Now, let’s use the zero option (2nd Calc) on the graphing calculator to get a more accurate estimate of the zeroes and check out our observed answers.
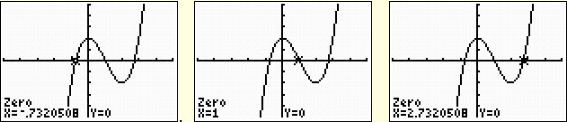
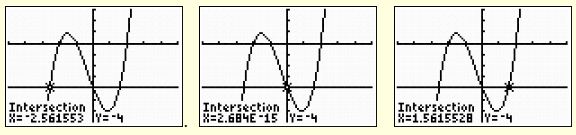
2. Use the graph at the right to estimate the solutions of the equation
![]()
Look carefully at this question. This equation was NOT set equal to zero and then graphed. Instead, the expression on each side of the equal sign was graphed separately. You are not looking to find where the blue graph crosses the x-axis. You are looking to find where the blue graph and the red graph intersect.
By observation, one estimated answer may be:
-2.5, 0, and 1.5
This problem could also be solved by setting the original equation equal to zero.
This problem could also be solved by setting the original equation equal to zero.
Now, let’s use the intersect option (2nd Calc) on the graphing calculator to get a more accurate estimate of the zeroes and check out our observed answers.
Read More:
- What is a Polynomial?
- Types of Polynomials
- Monomials, Binomials, and Polynomials
- Adding Polynomials
- Subtracting Polynomials
- Dividing Polynomials
- Polynomials – Long Division
- Degree (of an Expression)
- Special Binomial Products
- Multiplying Binomials
- Difference of Two Cubes
- Polynomial Remainder Theorem
- Factoring in Algebra
- Factorization of Polynomials Using Factor Theorem
- How do you use the factor theorem?
- How to factorise a polynomial by splitting the middle term?
- Review Factoring Polynomials
- Zeros of a Polynomial Function
- Factors and Coefficients of a Polynomial
- Roots of Polynomials: Sums and Products
- Solving Polynomial Equations of Higher Degree