What is meant by cathode ray oscilloscope?
Cathode Ray Oscilloscope or Cathode Ray Oscilloscope Pdf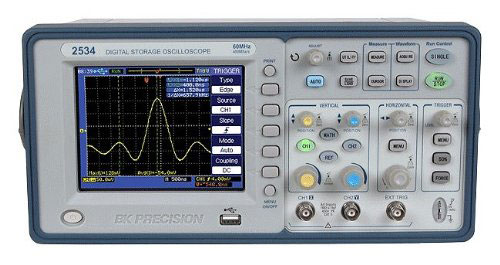
- A cathode ray oscilloscope (C.R.O.) is an instrument that converts electrical signals to a visual display.
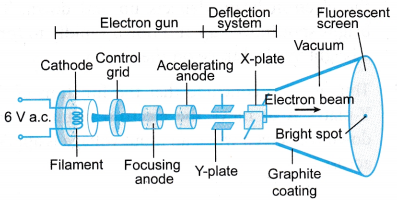
- The main structure of the C.R.O. is a highly evacuated cathode ray tube (C.R.T.) which emits an electron beam known as cathode ray beam.
- The cathode ray tube consists of three main components:
(a) The electron gun
(b) The deflection system
(c) The fluorescent screen - Figure shows the main structure of a C.R.O.
People also ask
Cathode Ray Oscilloscope Construction and Working
Electron Gun
- The electron gun is used to produce a narrow beam of electrons. It consists of:
(a) A filament enclosed in a cylindrical cathode
(b) A ring-shaped electrode called the control grid
(c) Two cylindrical anode electrodes known as focusing anode and accelerating anode - The filament is heated when current flows through it. It is used to heat up the cathode.
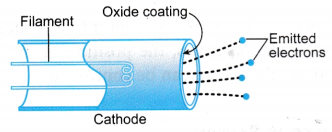
- The cathode of a C.R.O. consists of a small diameter nickel cap. The closed end of the cap is coated with emitting material as shown in Figure. This type of cathode can produce a highly concentrated electron beam.
- The control grid is placed between the cathode and anodes. It is made negative with respect to the cathode.
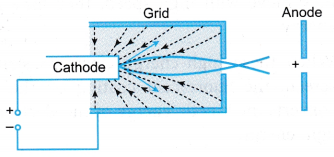
- This is to control the number of electrons in the beam. When the grid is adjusted more negative, the number of electrons emitted from the electron gun decreases and the spot on the screen is less bright. Thus, the negative voltage of the grid is used as the brightness control.
- These electrons are accelerated towards the anodes by the electric field set up between the cathode and anodes.
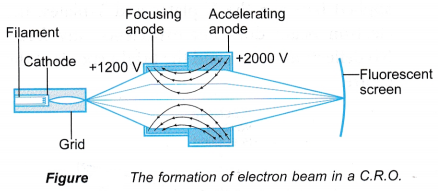
- The focusing anode serves a dual purpose; to attract electrons from the area of the control grid and to focus the electrons into a beam.
- The accelerating anode is used to accelerate the electrons in the beam towards the front of the tube or screen.
Deflection System
- The deflection system allows the electron beam to be deflected from its straight-line path when it leaves the electron gun.
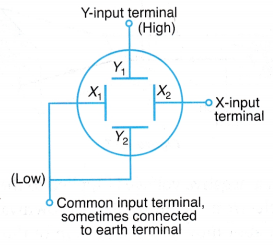
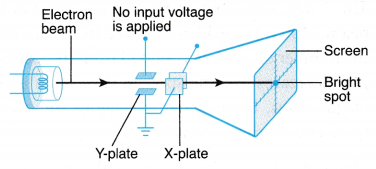
- The deflection system consists of two sets of parallel plates. One set which is arranged vertically is known as X-plates and the other set which is arranged horizontally is known as Y-plates, as shown in Figure.
- If no input voltage or potential difference is applied between the X-plates and Y-plates, the electron beam does not experience any force. No deflection occurs and the bright spot is at the centre.
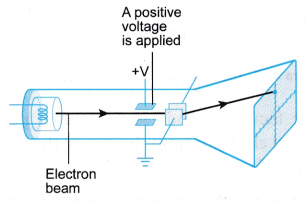
- When a positive voltage or potential difference is applied to the Y-plates, the electrons in the beam will experience a force acting upwards causing the electron beam to deflect upwards. The bright spot moves to the top of the screen.
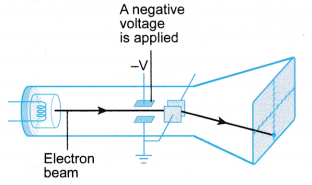
- When a negative voltage is applied to the Y-plates, the electron beam deflects downwards. The bright spot moves to the bottom of the screen.
- When an a.c. voltage is applied to the Y-plates, the electron beam deflects up and down. The bright spot moves up and down rapidly to form a bright vertical trace on the screen.
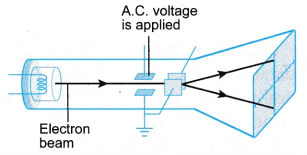
- Thus we can conclude that the function of the Y-plates is to move the electron beam up and down the screen when an input voltage is applied across it.
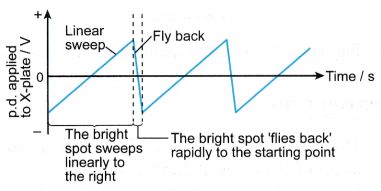
- The function of the X-plates is to sweep the electron beam across the screen horizontally from left to right at a steady speed. The X-plates are usually connected to a time-base circuit that generates a time-varying voltage as shown in Figure.
- Therefore, by applying appropriate voltages to the deflection plates, the position of the bright spot on the screen can be controlled.
Fluorescent Screen
- The fluorescent screen is coated on the inside surface with some fluorescent material such as phosphor or zinc sulphide.
- When electrons in the beam strike the screen, the material fluoresces and becomes luminous or glows. This enables a bright spot to appear wherever an electron beam strikes the screen.
- Electrons are particles and they have mass. Since they move with high speed, they have kinetic energy.
- When these high-energy electrons strike the screen, the fluorescent coating on the screen converts the kinetic energy of the electrons into light energy.
What are the functions of an oscilloscope?
Figure shows the front panel of a typical C.R.O.
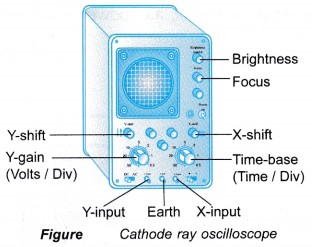 The functions and explanations for the control knobs are listed in Table.
| Control knob | Function / Explanation |
Brightness (Brilliance) |
|
| Focus |
|
| X-shift |
|
| Y-shift |
|
| Y-gain (Volt / Div) |
|
| AC / DC switch |
|
| Time-base (Time / Div) |
|
| X-input |
|
| Y-input |
|
| Earth |
|
What is the use of cathode ray oscilloscope?
Uses of the C.R.O.
Measuring Potential Difference:
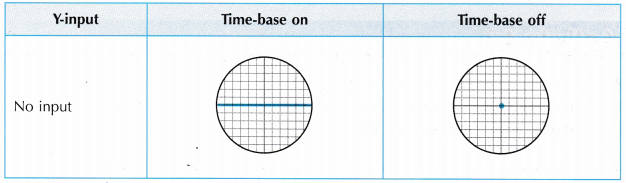
- To measure d.c. voltages using the C.R.O., the time-base is usually switched off.
- The upward or downward deflection of the bright spot depends on the connection of the terminals to the C.R.O. as shown in Figure.
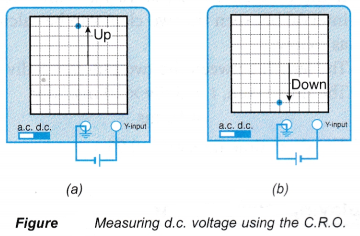
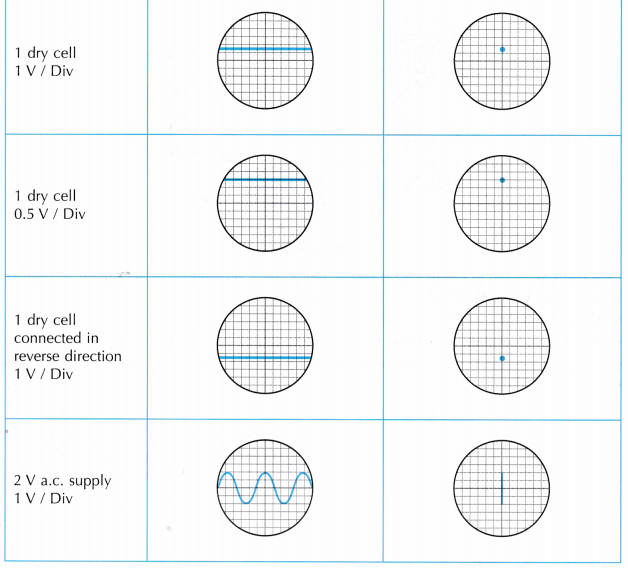
- From Figure (a), the value of the d.c. voltage can be measured as:
d.c. voltage
= [Displacement of the bright spot from zero position] × [The selected range of the Y-gain control]
= [Number of divisions] × [V / div]
= + 4 div × 1 V / div = 4 V - From Figure (b), the value of the d.c. voltage can be measured as:
d.c. voltage
= [Number of divisions] × [V / div]
= -4 div × 1 V / div
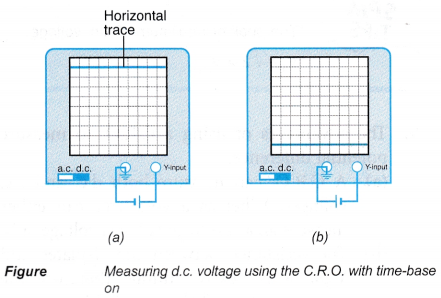
= -4 V - If the time-base is switched on, a horizontal trace is seen across the screen. Figure shows the traces displayed on the screen when the positive and negative terminals of the cell are connected to the Y-input and the earth terminals respectively. The values of the d.c. voltages are the same.
- When the time-base is turned off, the alternating potential difference input will cause the bright spot to fly up and down at high speed between its positive and negative peak values, tracing out a vertical line on the screen as shown in Figure (a).
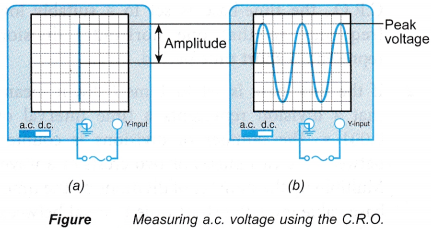
- From Figure (a), the value of the a.c. voltage can be measured as:
Peak voltage,
VP = [Height of vertical trace from zero position] × [The selected range on Y-gain control]
= [Number of divisions] × [V / div]
= + 4 div × 1 V / div
= 4 V - Figure (b) shows the wave form of the alternating voltage when the time-base is switched on.
- The advantages of using a C.R.O. to measure potential difference:
(a) A C.R.O. can measure both d.c. and a.c. voltages. Whereas a voltmeter can either measure an a.c. voltage or a d.c. voltage only.
(b) The resistance between the X-plates and Y-plates is nearly infinite; therefore the current in the C.R.O. is negligible.
(c) A C.R.O. has an immediate response compared to analogue voltmeters, which need a few moments to reach the correct value.
Measuring Short Time Intervals:
- To measure short time intervals using the C.R.O., the time-base is set to a suitably low frequency so that one horizontal division represents a short time period.
- If the time-base is set to 1 ms / div, it means that a division represents a time interval of 0.001 s. The number of divisions is counted between the two pulses or two crests of a wave. Multiplying the number of divisions by the time- base value gives the short time interval between pulses.
- When two claps are made close to a microphone which is connected to the Y-input and earth terminals, both pulses will be displayed on the screen with a short interval apart as shown in Figure.
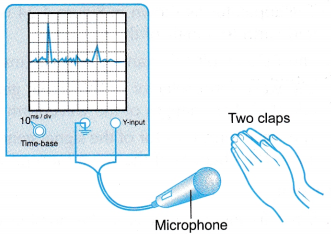
- The time lapse between the two claps can be obtained from the distance between the pulses. If the time-base is set at 10 ms / div, the time interval between the two claps can be calculated as follow:
The length between the two pulses = 5 div
The time taken, t = 5 div × 10 ms / div = 50 ms
The short time interval = 0.05 s
Displaying Wave Forms:
- A wave form is a representation of how alternating current (a.c.) varies with time.
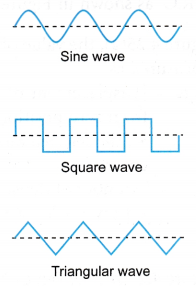
- If a suitable time-base frequency of the C.R.O. is selected for displaying the wave form, the time-varying patterns of the wave form can then be studied. Figure are three common wave forms generated from a signal generator.
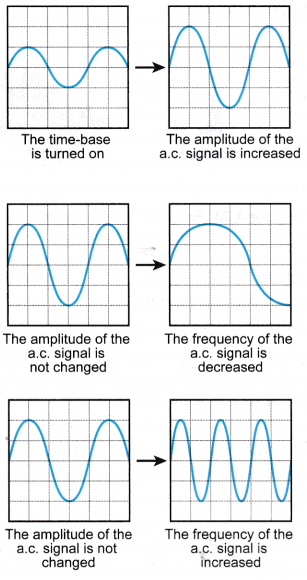
- Figure shows the sinusoidal wave forms when an a.c. voltage is connected to the Y-input and earth terminals with the time-base turned on. The amplitude or the frequency of the signal is manipulated in each case.
- Electrical signals representing physical quantities such as loudness of sound, intensity of light, magnetic field strength and heart beats, can be visually displayed using the C.R.O. This allows the characteristics of those waves to be studied.
Cathode Ray Oscilloscope Experiment
Aims:
A. To measure potential difference using a C.R.O.
B. To measure short time intervals using a C.R.O.
C. To display wave forms using a C.R.O.
Materials: Dry cells, connecting wires
Apparatus: Cathode ray oscilloscope, signal generator, a.c. power supply, microphone, ticker timer
A. Measuring Potential Difference
Method: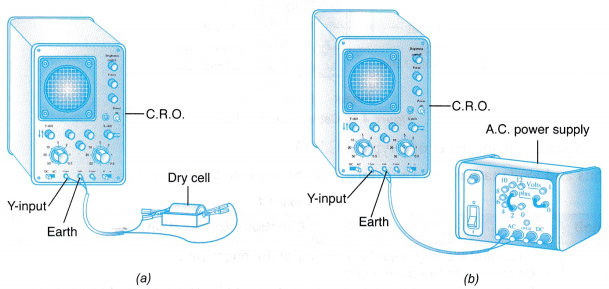
- The C.R.O. is switched on. When a bright spot appears on the screen, it is brought to the centre of the screen by turning the X-shift and Y-shift controls.
- The brightness of the spot is adjusted by turning the brightness control. The focus control is turned slowly and the sharpness of the spot is adjusted.
- The selector switch is pushed to DC position. The time-base is turned off. The Y-gain is set to 1 V / div.
- The terminals of a dry cell is connected to the Y-input and the earth terminals as shown in Figure (a).
- The displacement of the bright spot from the zero position is recorded. Then, the time-base is turned on and what happens to the bright spot and its position is observed. The voltage across the dry cell is calculated by multiplying the value of the displacement of the bright spot or line with the Y-gain.
- The Y-gain setting is changed to 0.5 V / div and the time-base is turned off. Steps 4 and 5 are repeated. The voltages of the dry cell calculated from the two settings are compared.
- The Y-gain is set back to 1 V / div. The terminals of the dry cell are reversed and connected back to the Y-input terminals. The position of the bright spot or line on the screen is observed and compared.
- Steps 4 to 7 are repeated by using two dry cells connected in series.
- The selector switch is now pushed to AC position. The time-base is turned off. The Y-gain is kept at 1 V / div.
- A 2 V AC from the power supply is connected to the Y-input and earth terminals as shown in Figure (b). A vertical trace is seen on the screen. The length of the vertical trace from the zero position is measured. The peak voltage is then calculated from the Y-gain setting.
- The time-base is now switched on. The shape of the trace is observed.
Observations:
Discussion:
- The voltage across the dry cell is the same as the e.m.f. of the cell. A smaller gain per division will give a more accurate reading as it is more sensitive.
- A vertical trace is seen on the screen when an a.c. voltage supply is connected to the C.R.O. The a.c. supply will cause the bright spot to move up and down vertically at high speed, forming a vertical trace.
- The height of the vertical trace from the zero position represents the peak voltage. The peak voltage of the a.c. supply can be calculated by measuring the height of the trace from the zero position.
Peak voltage, VP = Height of the trace from the zero position (number of division) × Y-gain setting - The effective potential difference of the a.c. supply is the root mean square value (r.m.s). The r.m.s. value of the a.c. voltage can be calculated by using:
\({{\text{V}}_{\text{r}\text{.m}\text{.s}}}=\text{ }\frac{{{\text{V}}_{\text{P}}}}{\sqrt{2}}\) - The advantage of using the C.R.O. as a voltmeter is that it is more accurate. This is because it has a nearly infinite internal resistance and therefore, the current that passes through it is negligible.
B. Measuring Short Time Intervals
Method: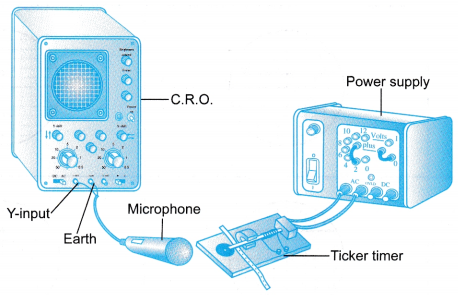
- The apparatus as shown in Figure is set by connecting a microphone to the Y-input and earth terminals of the C.R.O. and a ticker timer to the power supply.
- The time-base is turned on to 5 ms / div.
- The ticker timer is switched on and the trace on the screen of the C.R.O. is observed.
- The distance, d between the two adjacent peaks of the signal is determined. The time interval between the two peaks is calculated.
Results: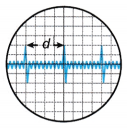
Distance between two adjacent peaks, d = 4 div
Time interval = d × 5 ms / div
= 4 div × 5 ms / div
= 20 ms
= 0.02 s
Discussion:
The C.R.O. is a better instrument to measure time intervals because it can detect small changes more accurately.
C. Displaying Wave Forms
Method: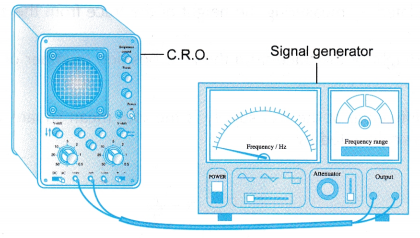
- The apparatus as shown in Figure is set by connecting the output of the signal generator to the Y-input and earth terminals of the C.R.O.
- The Y-gain (volt / div) and time-base (ms / div) are set to a suitable value.
- The wave form selector of the signal generator is switched to sinusoidal wave form and the frequency is l adjusted. The changes of the wave form on the screen are observed for different frequencies.
- The wave form selector of the signal generator is then switched to a triangular wave form and a square wave form. The changes of the wave form on the screen are observed for different frequencies.
Discussion:
- If the frequency increases, the number of complete waves increases. This is because the period for one complete wave decreases.
- To calculate the frequency of a wave using a C.R.O., the time-base setting has to be adjusted so that the period, T for a complete wave cycle can be easily determined. The frequency, f Then can be calculated from the equation f = 1/T.
Cathode Ray Oscilloscope Problems with Solutions
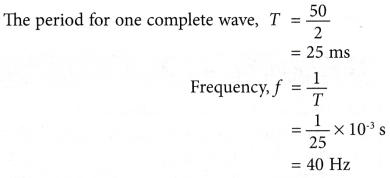
- Figure shows the trace displayed on the screen of a C.R.O. with the time-base set to 10 ms / div.
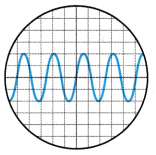
What is the frequency, f of the wave?
Solution:
Distance for two complete waves = 5 divisions
Therefore, the period or time taken for the bright spot to move this distance
= 5 div × 10 ms
= 50 ms
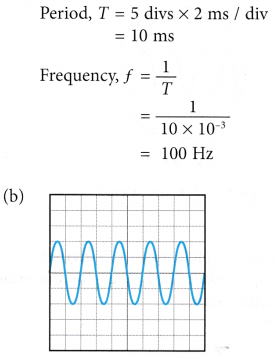
- Figure shows a wave form displayed on the screen of a C.R.O.
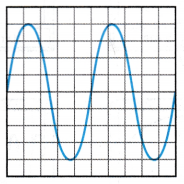
(a) If the controls on the C.R.O. are set at 0.5 V / div and 2 ms / div, find the peak voltage and the frequency of the input signal.
(b) Sketch the trace displayed on the screen if the settings are changed to 1 V / div and 5 ms / div.
Solution:
(a) Peak voltage, VP
= 4 divs × 0.5 V / div
= 2 V