Cartesian Coordinates
Rectangular Or Cartesian coordinates of a point:
The French Mathematician and Philosopher Rene Descartes first published his book La Geometric in 1637 in which he used algebra in the study of geometry. This he did by representing points in a plane by ordered pairs of real numbers, called Cartesian coordinates (named after Rene Descartes). In this section, we shall see how points in a plane are represented by the ordered pair of real numbers.
Cartesian coordinates axes:
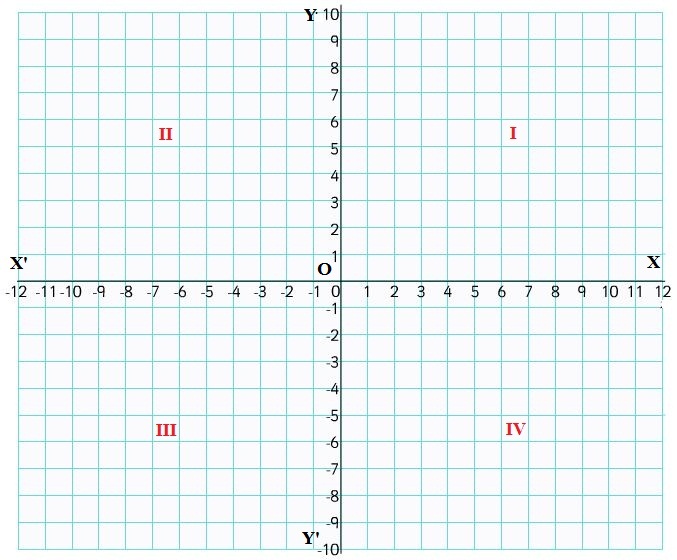
Let X’OX and Y’OY be two mutually perpendicular lines through a point O in the plane of a graph paper as shown in Fig. 11.1. The line X’OX is called the r-axis or axis of x the line Y’OY is known as the y-axis or axis of y, and the two lines X’OX and Y’OY taken together are called the coordinate axes or the axes of coordinates. The point O is called the origin.
Quadrants:
In Fig. 11.1, the coordinate axes X’OX and Y’OY divide the plane of the graph paper into four regions XOY, X’OY, X’OY’ and Y’OX. These four regions are called the quadrants. The regions XOY, X’OY, X’OY’ and Y’OX are known as the first, the second, the third and the fourth quadrants respectively.
Cartesian coordinates of a point:
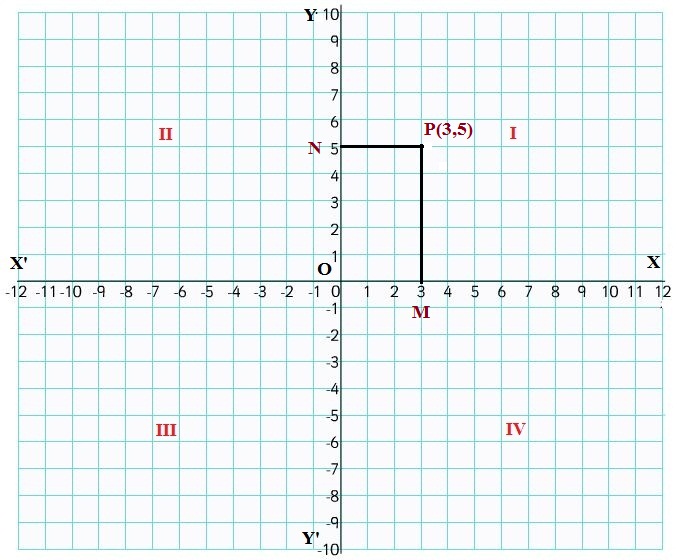
Let X’OX and Y’OY be the coordinate axes and let P be any point on the Plane of the paper. Draw PM ⊥ X’OX and PN ⊥ Y’OY.
The length of the line segment OM is called the x-coordinate or abscissa of point P and the length of the directed line segment ON is called the y-coordinate or ordinate of point P.
If OM = 3 units and ON = 5 units, then the x-coordinate or abscissa of point P is 3 and the y-coordinate or ordinate of P is 5 and we say that the coordinates of P are (3, 5). Note that (3,5) is an ordered pair in which the positions of 3 and 5 cannot he interchanged.
Thus, for a given point P, the abscissa and ordinate are the distances of the point P from y-axis and x-axis respectively.
If we take a point on x-axis, then clearly the distance of this point from x-axis is 0 and therefore the ordinate of this point is 0.
Thus, the ordinate or y-coordinate of every point on x-axis is 0 and the coordinates of a point on x-axis are of the form (x, 0).
Similarly, if we take a point on y-axis then its distance from y-axis is 0 and therefore, the x-coordinate or abscissa of the point is 0.
Thus, the abscissa or coordinate of every point on y-axis is zero and the coordinates of a point on y-axis are of the form (0, y)
The coordinate of the origin are taken as (0, 0).
Convention of signs:
Let X’OX and Y’OY be the coordinate axes. As discussed earlier that regioons XOY, X’OY, X’OY’ and Y’OX are known as the first, the second, the third and the fourth quadrants respectively. The ray OX is taken as positive x-axis, OX’ as negative x-axis,OY as positive y-axis and OY’as negative y-axis.
This means that any distance measured along OX will be taken as positive and the distance moved along OX’ will be negative. Similarly, the distance moved along or parallel to OY will taken as positive and the distance along OY’ will be negative.
In view of the above sign convention, we find that:
In I quadrant: x > 0, y > 0
In II quadrant: x < 0, y > 0
In III quadrant: x < 0, y < 0
In IV quadrant: x > 0, y < 0.
Plotting of points:
In order to plot the points in a plane, we may u the following algorithm:
Algorithm:
STEP I: Draw two mutually perpendicular lines on the graph paper, One horizontal and other vertical.
STEP II: Mark their intersection point as O(origin). The horizontal line as X’OX and the vertical line as Y’OY. The line X’OX is the x-axis and the line Y’OY as the y-axis.
STEP III: Choose a suitable scale on x-axis and y-axis and mark the points on both the axes.
STEP IV: Obtain the coordinates of the point which is to be plotted. Let the point be P (a, b). To plot
this point, start from the origin and move |a| units along OX or OX’ according as ‘a’is positive or negative. Suppose we arrive at point M. From point M move vertically upward or down ward through |b| units according as b is positive or negative. The point where we arrive finally is the required point P (a, b).
The following examples will illustrate the above procedure.
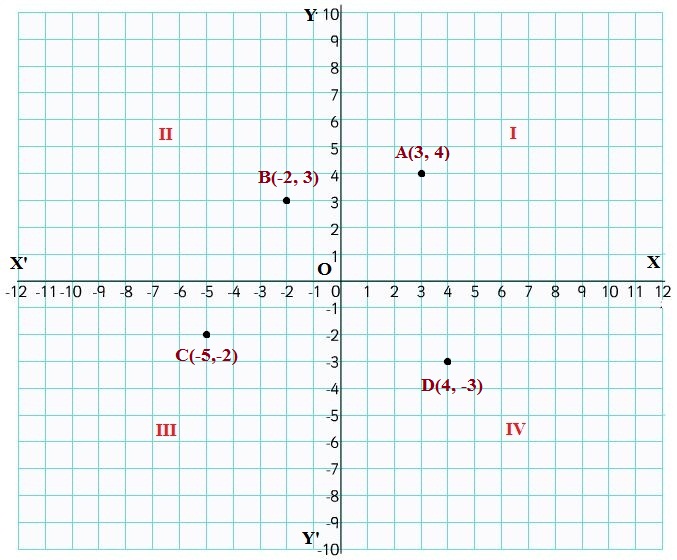
Example: Plot the following points on a graph paper:
(1) (3,4) 01) (- 2, 3) (iii) (- 5, – 2) (iv) (4, – 3)
Solution: X’OX and Y’OY be the coordinate axes. Then the given four points may be plotted as given below: